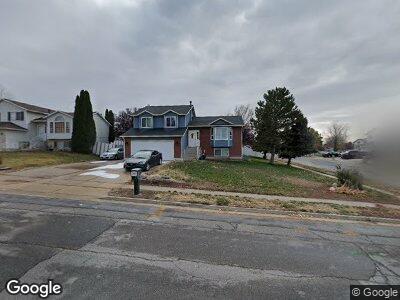
1209 W 1750 N Clearfield, UT 84015
Estimated Value: $424,000 - $487,000
4
Beds
2
Baths
2,005
Sq Ft
$227/Sq Ft
Est. Value
About This Home
This home is located at 1209 W 1750 N, Clearfield, UT 84015 and is currently estimated at $455,219, approximately $227 per square foot. 1209 W 1750 N is a home located in Davis County with nearby schools including Clinton Elementary School, Sunset Junior High School, and Clearfield High School.
Ownership History
Date
Name
Owned For
Owner Type
Purchase Details
Closed on
May 1, 2013
Sold by
Hatch Ruth E and Pettitt Leon
Bought by
Pettitt Ruth E and Pettitt Leon
Current Estimated Value
Home Financials for this Owner
Home Financials are based on the most recent Mortgage that was taken out on this home.
Original Mortgage
$162,500
Outstanding Balance
$80,977
Interest Rate
3.51%
Mortgage Type
New Conventional
Estimated Equity
$368,532
Purchase Details
Closed on
Dec 14, 2006
Sold by
Hatch Ruth E
Bought by
Pettitt Leon and Hatch Ruth E
Home Financials for this Owner
Home Financials are based on the most recent Mortgage that was taken out on this home.
Original Mortgage
$35,000
Interest Rate
5.94%
Mortgage Type
Stand Alone Second
Purchase Details
Closed on
Aug 8, 2001
Sold by
Findlay Scott R and Findlay Jennifer K
Bought by
Mckinney Kevin P and Mckinney Coyla D
Home Financials for this Owner
Home Financials are based on the most recent Mortgage that was taken out on this home.
Original Mortgage
$135,091
Interest Rate
7.1%
Mortgage Type
FHA
Create a Home Valuation Report for This Property
The Home Valuation Report is an in-depth analysis detailing your home's value as well as a comparison with similar homes in the area
Home Values in the Area
Average Home Value in this Area
Purchase History
| Date | Buyer | Sale Price | Title Company |
|---|---|---|---|
| Pettitt Ruth E | -- | North American Title | |
| Pettitt Leon | -- | None Available | |
| Hatch Ruth E | -- | Bonneville Superior Title Co | |
| Mckinney Kevin P | -- | Founders Title Co |
Source: Public Records
Mortgage History
| Date | Status | Borrower | Loan Amount |
|---|---|---|---|
| Open | Pettitt Ruth E | $162,500 | |
| Closed | Hatch Ruth E | $35,000 | |
| Closed | Hatch Ruth E | $140,000 | |
| Previous Owner | Mckinney Kevin P | $135,091 |
Source: Public Records
Tax History Compared to Growth
Tax History
| Year | Tax Paid | Tax Assessment Tax Assessment Total Assessment is a certain percentage of the fair market value that is determined by local assessors to be the total taxable value of land and additions on the property. | Land | Improvement |
|---|---|---|---|---|
| 2024 | $2,282 | $220,550 | $94,491 | $126,059 |
| 2023 | $2,086 | $373,000 | $107,532 | $265,468 |
| 2022 | $2,235 | $221,100 | $65,749 | $155,351 |
| 2021 | $2,051 | $301,000 | $82,358 | $218,642 |
| 2020 | $1,783 | $259,000 | $70,005 | $188,995 |
| 2019 | $1,727 | $245,000 | $81,761 | $163,239 |
| 2018 | $1,592 | $222,000 | $69,052 | $152,948 |
| 2016 | $1,410 | $101,530 | $26,894 | $74,636 |
| 2015 | $1,347 | $92,180 | $26,894 | $65,286 |
| 2014 | $1,278 | $88,854 | $26,894 | $61,960 |
| 2013 | -- | $90,412 | $27,143 | $63,269 |
Source: Public Records
Map
Nearby Homes