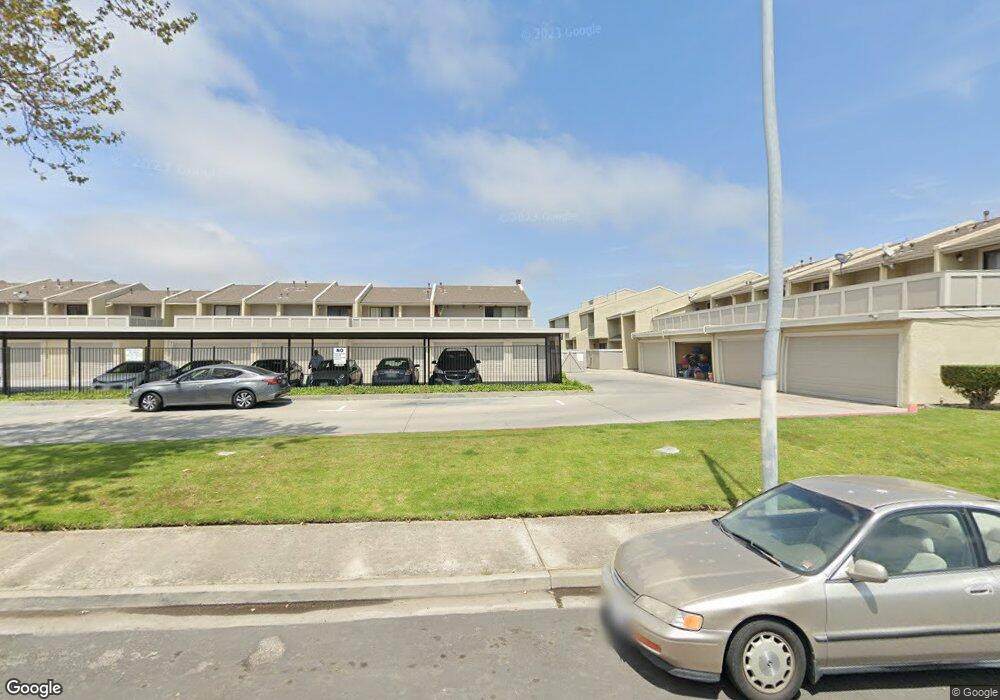
1209 W Cypress Ave Unit H Lompoc, CA 93436
Estimated Value: $332,000 - $339,000
2
Beds
2
Baths
1,044
Sq Ft
$322/Sq Ft
Est. Value
About This Home
This home is located at 1209 W Cypress Ave Unit H, Lompoc, CA 93436 and is currently estimated at $336,437, approximately $322 per square foot. 1209 W Cypress Ave Unit H is a home located in Santa Barbara County with nearby schools including Miguelito Elementary School, Lompoc Valley Middle School, and Lompoc High School.
Ownership History
Date
Name
Owned For
Owner Type
Purchase Details
Closed on
Jun 3, 2025
Sold by
Iles-Brunk Sheryl
Bought by
Sheryl Iles-Brunk Living Trust and Iles-Brunk
Current Estimated Value
Purchase Details
Closed on
Jun 5, 2002
Sold by
Mccarthy John H
Bought by
Guadarrama Refugio and Guadarrama Esmeralda
Home Financials for this Owner
Home Financials are based on the most recent Mortgage that was taken out on this home.
Original Mortgage
$119,200
Interest Rate
8.24%
Mortgage Type
Purchase Money Mortgage
Purchase Details
Closed on
Apr 4, 2001
Sold by
Lee Malia F
Bought by
Mccarthy John H
Home Financials for this Owner
Home Financials are based on the most recent Mortgage that was taken out on this home.
Original Mortgage
$95,200
Interest Rate
6.98%
Mortgage Type
Purchase Money Mortgage
Purchase Details
Closed on
Oct 3, 1994
Sold by
Scheffer Mark G W and Scheffer Malia F
Bought by
Lee Malia F
Create a Home Valuation Report for This Property
The Home Valuation Report is an in-depth analysis detailing your home's value as well as a comparison with similar homes in the area
Home Values in the Area
Average Home Value in this Area
Purchase History
| Date | Buyer | Sale Price | Title Company |
|---|---|---|---|
| Sheryl Iles-Brunk Living Trust | -- | None Listed On Document | |
| Guadarrama Refugio | $149,000 | Chicago Title Co | |
| Mccarthy John H | -- | Chicago Title Co | |
| Mccarthy John H | $119,000 | Chicago Title Co | |
| Lee Malia F | -- | -- |
Source: Public Records
Mortgage History
| Date | Status | Borrower | Loan Amount |
|---|---|---|---|
| Previous Owner | Guadarrama Refugio | $119,200 | |
| Previous Owner | Mccarthy John H | $95,200 |
Source: Public Records
Tax History Compared to Growth
Tax History
| Year | Tax Paid | Tax Assessment Tax Assessment Total Assessment is a certain percentage of the fair market value that is determined by local assessors to be the total taxable value of land and additions on the property. | Land | Improvement |
|---|---|---|---|---|
| 2025 | $3,311 | $304,034 | $106,120 | $197,914 |
| 2023 | $3,311 | $286,500 | $100,000 | $186,500 |
| 2022 | $2,191 | $192,000 | $65,000 | $127,000 |
| 2021 | $1,887 | $160,000 | $54,000 | $106,000 |
| 2020 | $1,759 | $149,000 | $50,000 | $99,000 |
| 2019 | $1,764 | $149,000 | $50,000 | $99,000 |
| 2018 | $1,689 | $142,000 | $48,000 | $94,000 |
| 2017 | $1,609 | $135,000 | $46,000 | $89,000 |
| 2016 | $1,400 | $117,000 | $40,000 | $77,000 |
| 2015 | $1,173 | $97,000 | $33,000 | $64,000 |
| 2014 | $1,120 | $92,000 | $31,000 | $61,000 |
Source: Public Records
Map
Nearby Homes
- 1209 W Cypress Ave
- 1209 W Cypress Ave Unit A
- 1209 W Cypress Ave Unit B
- 1209 W Cypress Ave Unit D
- 1209 W Cypress Ave Unit E
- 1209 W Cypress Ave Unit F
- 1209 W Cypress Ave Unit G
- 1209 W Cypress Ave Unit I
- 1205 W Cypress Ave
- 1205 W Cypress Ave Unit H
- 1205 W Cypress Ave Unit G
- 1205 W Cypress Ave Unit F
- 1205 W Cypress Ave Unit E
- 1205 W Cypress Ave Unit D
- 1205 W Cypress Ave Unit C
- 1205 W Cypress Ave Unit B
- 1205 W Cypress Ave Unit A
- 1213 W Cypress Apt D Ave
- 1113 W Cypress Apt F Ave
- 1113 W Cypress Apt G Ave