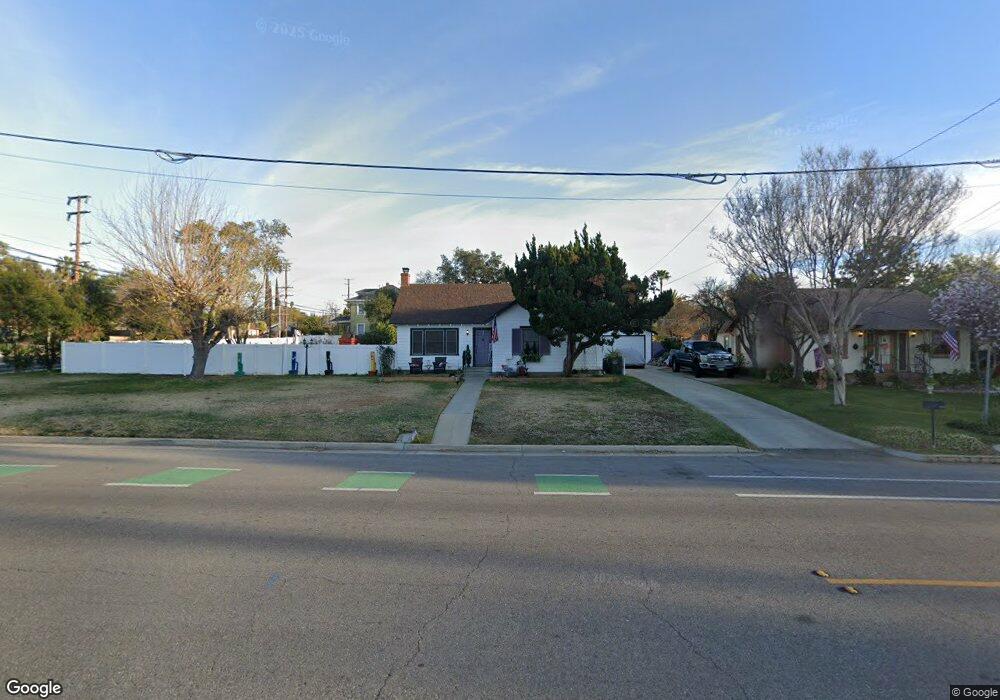
1209 W Olive Ave Redlands, CA 92373
South Redlands NeighborhoodEstimated Value: $628,000 - $687,000
3
Beds
1
Bath
1,619
Sq Ft
$400/Sq Ft
Est. Value
About This Home
This home is located at 1209 W Olive Ave, Redlands, CA 92373 and is currently estimated at $648,348, approximately $400 per square foot. 1209 W Olive Ave is a home located in San Bernardino County with nearby schools including Smiley Elementary School, Cope Middle School, and Redlands Senior High School.
Ownership History
Date
Name
Owned For
Owner Type
Purchase Details
Closed on
Nov 19, 2010
Sold by
Hancock Howard R and Hancock Cathleen
Bought by
Sedgwick Shannon
Current Estimated Value
Home Financials for this Owner
Home Financials are based on the most recent Mortgage that was taken out on this home.
Original Mortgage
$220,000
Interest Rate
4.43%
Mortgage Type
New Conventional
Purchase Details
Closed on
Jul 30, 2004
Sold by
Barnes David F
Bought by
Hancock Howard R and Hancock Cathleen
Home Financials for this Owner
Home Financials are based on the most recent Mortgage that was taken out on this home.
Original Mortgage
$306,400
Interest Rate
5.97%
Mortgage Type
Purchase Money Mortgage
Create a Home Valuation Report for This Property
The Home Valuation Report is an in-depth analysis detailing your home's value as well as a comparison with similar homes in the area
Home Values in the Area
Average Home Value in this Area
Purchase History
| Date | Buyer | Sale Price | Title Company |
|---|---|---|---|
| Sedgwick Shannon | $275,000 | Fidelity National Title Ie | |
| Hancock Howard R | $383,000 | Chicago Title Company |
Source: Public Records
Mortgage History
| Date | Status | Borrower | Loan Amount |
|---|---|---|---|
| Previous Owner | Sedgwick Shannon | $220,000 | |
| Previous Owner | Hancock Howard R | $306,400 | |
| Closed | Hancock Howard R | $33,489 |
Source: Public Records
Tax History Compared to Growth
Tax History
| Year | Tax Paid | Tax Assessment Tax Assessment Total Assessment is a certain percentage of the fair market value that is determined by local assessors to be the total taxable value of land and additions on the property. | Land | Improvement |
|---|---|---|---|---|
| 2025 | $3,696 | $324,137 | $74,307 | $249,830 |
| 2024 | $3,696 | $317,781 | $72,850 | $244,931 |
| 2023 | $3,690 | $311,550 | $71,422 | $240,128 |
| 2022 | $3,636 | $305,442 | $70,022 | $235,420 |
| 2021 | $3,700 | $299,453 | $68,649 | $230,804 |
| 2020 | $3,644 | $296,382 | $67,945 | $228,437 |
| 2019 | $3,541 | $290,571 | $66,613 | $223,958 |
| 2018 | $3,451 | $284,874 | $65,307 | $219,567 |
| 2017 | $3,421 | $279,288 | $64,026 | $215,262 |
| 2016 | $3,380 | $273,812 | $62,771 | $211,041 |
| 2015 | $3,354 | $269,699 | $61,828 | $207,871 |
| 2014 | $3,292 | $264,416 | $60,617 | $203,799 |
Source: Public Records
Map
Nearby Homes
- 133 S San Mateo St
- 1239 Fulbright Ave
- 325 Lakeside Ave
- 1302 San Pablo Ave
- 162 Lakeside Ave
- 975 Brookside Ave
- 1417 Bella Vista Crescent
- 526 Nottingham Dr
- 527 Nottingham Dr
- 1110 W Cypress Ave
- 1044 W Cypress Ave
- 87 Tennessee St Unit C
- 91 Tennessee St Unit C
- 1522 Blossom Ct
- 628 W Fern Ave
- 616 Monterey St
- 636 Harding Dr
- 608 Glenwood Dr
- 230 S Buena Vista St
- 153 Channing St
- 1215 W Olive Ave
- 206 S San Mateo St
- 1219 W Olive Ave
- 208 S San Mateo St
- 210 S San Mateo St
- 150 S San Mateo St
- 1133 W Olive Ave
- 203 San Rafael St
- 207 San Rafael St
- 203 S San Mateo St
- 212 S San Mateo St
- 1212 W Olive Ave
- 148 S San Mateo St
- 1216 W Olive Ave
- 1218 W Olive Ave
- 209 S San Mateo St
- 211 San Rafael St
- 214 S San Mateo St
- 1129 W Olive Ave
- 144 S San Mateo St