Estimated Value: $109,143 - $118,000
3
Beds
1
Bath
1,380
Sq Ft
$83/Sq Ft
Est. Value
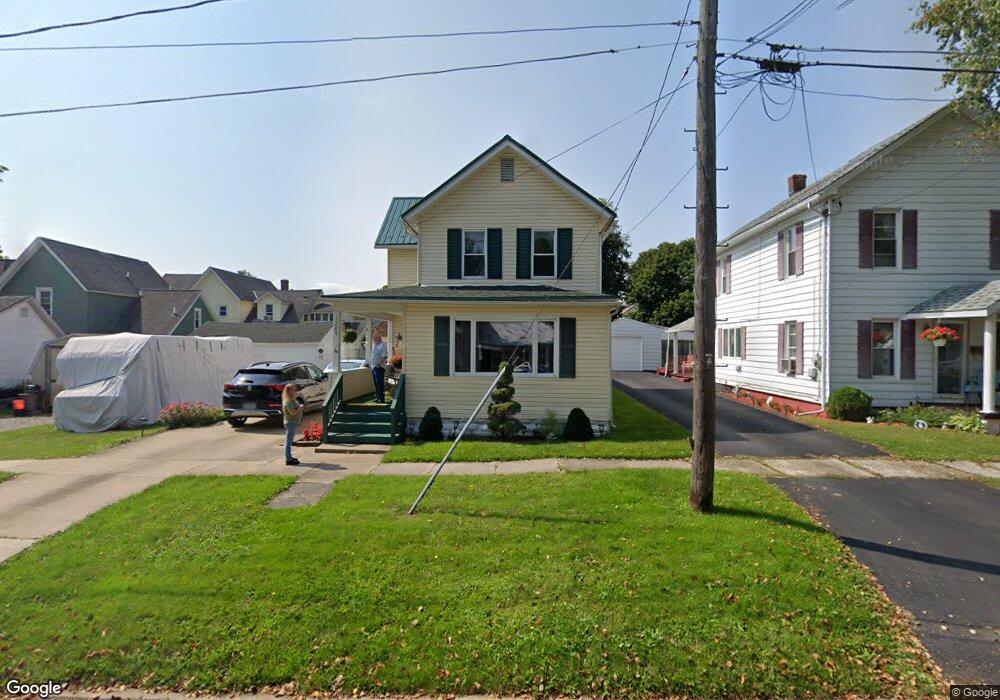
About This Home
This home is located at 1209 Walnut St, Olean, NY 14760 and is currently estimated at $114,048, approximately $82 per square foot. 1209 Walnut St is a home located in Cattaraugus County with nearby schools including Olean Intermediate-Middle School, Olean Senior High School, and New Life Christian School.
Ownership History
Date
Name
Owned For
Owner Type
Purchase Details
Closed on
Mar 28, 2025
Sold by
Graves Lynn and Buchanan Cynthia A
Bought by
Buchanan Christopher and Buchanan Cynthia A
Current Estimated Value
Purchase Details
Closed on
May 13, 2013
Sold by
Chipchak Lorraine
Bought by
Graves Lynn
Purchase Details
Closed on
Dec 4, 2002
Sold by
Panus Grant
Bought by
Chipchak Lorraine
Purchase Details
Closed on
Jun 6, 1997
Create a Home Valuation Report for This Property
The Home Valuation Report is an in-depth analysis detailing your home's value as well as a comparison with similar homes in the area
Home Values in the Area
Average Home Value in this Area
Purchase History
| Date | Buyer | Sale Price | Title Company |
|---|---|---|---|
| Buchanan Christopher | -- | None Available | |
| Graves Lynn | -- | Daniel R. Palumbo | |
| Graves Lynn M | -- | Daniel R. Palumbo | |
| Chipchak Lorraine | -- | Gerardus A. Backhaus | |
| Chipchak Lorraine | -- | Gerardus A. Backhaus | |
| -- | -- | -- | |
| -- | -- | -- | |
| -- | -- | -- | |
| -- | -- | -- |
Source: Public Records
Tax History
| Year | Tax Paid | Tax Assessment Tax Assessment Total Assessment is a certain percentage of the fair market value that is determined by local assessors to be the total taxable value of land and additions on the property. | Land | Improvement |
|---|---|---|---|---|
| 2025 | $4,552 | $72,000 | $3,500 | $68,500 |
| 2024 | $4,552 | $72,000 | $3,500 | $68,500 |
| 2023 | $2,711 | $72,000 | $3,500 | $68,500 |
| 2022 | $2,750 | $72,000 | $3,500 | $68,500 |
| 2021 | $2,829 | $72,000 | $3,500 | $68,500 |
| 2020 | $1,421 | $72,000 | $3,500 | $68,500 |
| 2019 | $417 | $72,000 | $3,500 | $68,500 |
| 2018 | $2,456 | $72,000 | $3,500 | $68,500 |
| 2017 | $1,442 | $72,000 | $3,500 | $68,500 |
| 2016 | $1,424 | $72,000 | $3,500 | $68,500 |
| 2015 | -- | $72,000 | $3,500 | $68,500 |
| 2014 | -- | $72,000 | $3,500 | $68,500 |
Source: Public Records
Map
Nearby Homes
Your Personal Tour Guide
Ask me questions while you tour the home.