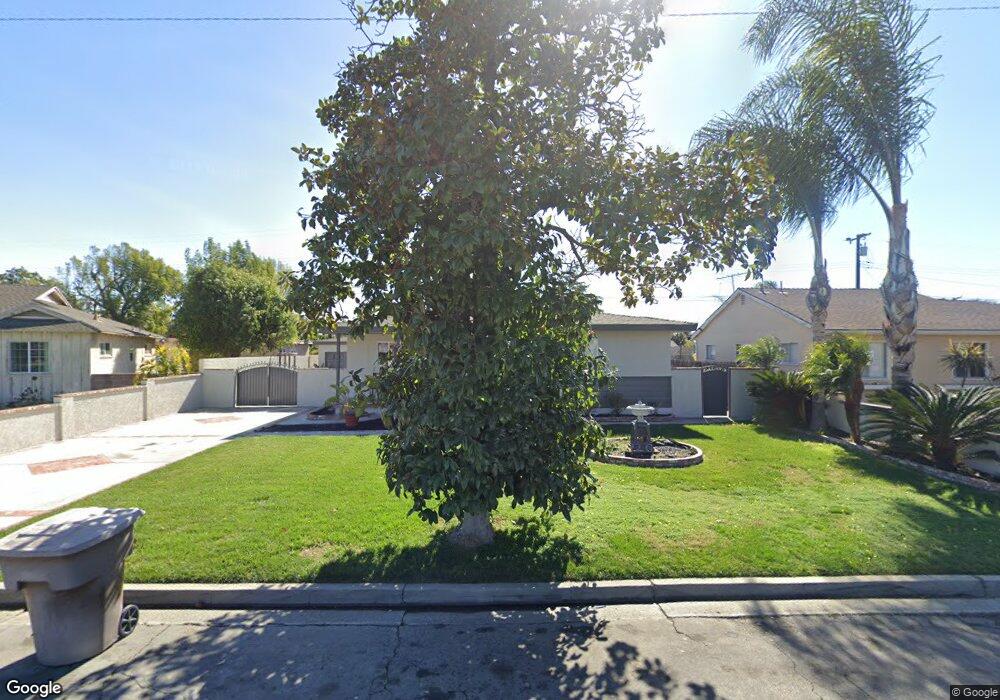
12092 Stanford Ave Garden Grove, CA 92840
Estimated Value: $854,490 - $992,000
2
Beds
1
Bath
1,036
Sq Ft
$900/Sq Ft
Est. Value
About This Home
This home is located at 12092 Stanford Ave, Garden Grove, CA 92840 and is currently estimated at $932,373, approximately $899 per square foot. 12092 Stanford Ave is a home located in Orange County with nearby schools including Violette Elementary School, Izaak Walton Intermediate School, and Santiago High School.
Ownership History
Date
Name
Owned For
Owner Type
Purchase Details
Closed on
Nov 30, 2020
Sold by
Quintana Irma
Bought by
Quintana Irma and Quintana Ralph
Current Estimated Value
Home Financials for this Owner
Home Financials are based on the most recent Mortgage that was taken out on this home.
Original Mortgage
$143,000
Interest Rate
2.7%
Mortgage Type
New Conventional
Purchase Details
Closed on
Dec 31, 1998
Sold by
Irma Quintana
Bought by
Quintana Irma
Home Financials for this Owner
Home Financials are based on the most recent Mortgage that was taken out on this home.
Original Mortgage
$108,000
Interest Rate
6.73%
Purchase Details
Closed on
Jul 5, 1994
Sold by
Quintana Ralph F
Bought by
Quintana Irma
Home Financials for this Owner
Home Financials are based on the most recent Mortgage that was taken out on this home.
Original Mortgage
$95,000
Interest Rate
5.87%
Create a Home Valuation Report for This Property
The Home Valuation Report is an in-depth analysis detailing your home's value as well as a comparison with similar homes in the area
Home Values in the Area
Average Home Value in this Area
Purchase History
| Date | Buyer | Sale Price | Title Company |
|---|---|---|---|
| Quintana Irma | -- | Fidelity National Title Co | |
| Quintana Irma | -- | First American Title Ins Co | |
| Quintana Irma | -- | North American Title Co |
Source: Public Records
Mortgage History
| Date | Status | Borrower | Loan Amount |
|---|---|---|---|
| Closed | Quintana Irma | $143,000 | |
| Closed | Quintana Irma | $108,000 | |
| Closed | Quintana Irma | $95,000 |
Source: Public Records
Tax History Compared to Growth
Tax History
| Year | Tax Paid | Tax Assessment Tax Assessment Total Assessment is a certain percentage of the fair market value that is determined by local assessors to be the total taxable value of land and additions on the property. | Land | Improvement |
|---|---|---|---|---|
| 2025 | $1,877 | $130,473 | $84,978 | $45,495 |
| 2024 | $1,877 | $127,915 | $83,312 | $44,603 |
| 2023 | $1,837 | $125,407 | $81,678 | $43,729 |
| 2022 | $1,794 | $122,949 | $80,077 | $42,872 |
| 2021 | $1,768 | $120,539 | $78,507 | $42,032 |
| 2020 | $1,747 | $119,304 | $77,702 | $41,602 |
| 2019 | $1,726 | $116,965 | $76,178 | $40,787 |
| 2018 | $1,686 | $114,672 | $74,684 | $39,988 |
| 2017 | $1,646 | $110,744 | $73,220 | $37,524 |
| 2016 | $1,574 | $108,573 | $71,784 | $36,789 |
| 2015 | $1,552 | $106,943 | $70,706 | $36,237 |
| 2014 | $1,516 | $104,849 | $69,321 | $35,528 |
Source: Public Records
Map
Nearby Homes
- 12727 West St
- 12861 West St Unit 157
- 12861 West St Unit 100
- 12222 Emrys Ave
- 12662 Woodland Ln
- 13052 Rockinghorse Rd
- 13111 Rainbow St
- 12905 Palm St
- 12970 Newhope St
- 12851 Newhope St
- 12850 Palm St Unit 6
- 12842 Palm St Unit 108
- 12842 Palm St Unit 301
- 12691 Sweetbriar Dr
- 12621 Sweetbriar Dr
- 12246 Nadine Cir
- 12342 Quartz Place
- 11841 Shetland Rd
- 12848 Timber Rd Unit 33
- 13096 Blackbird St Unit 67
- 12082 Stanford Ave
- 12102 Stanford Ave
- 12062 Stanford Ave
- 12101 Dunklee Ln
- 12091 Stanford Ave
- 12091 Dunklee Ln
- 12081 Stanford Ave
- 12121 Dunklee Ln
- 12052 Stanford Ave
- 12071 Dunklee Ln
- 12061 Stanford Ave
- 12132 Stanford Ave
- 12121 Stanford Ave
- 12721 Dungan Ln
- 12131 Dunklee Ln
- 12061 Dunklee Ln
- 12042 Stanford Ave
- 12722 Merrill St
- 12131 Stanford Ave
- 12722 Dungan Ln