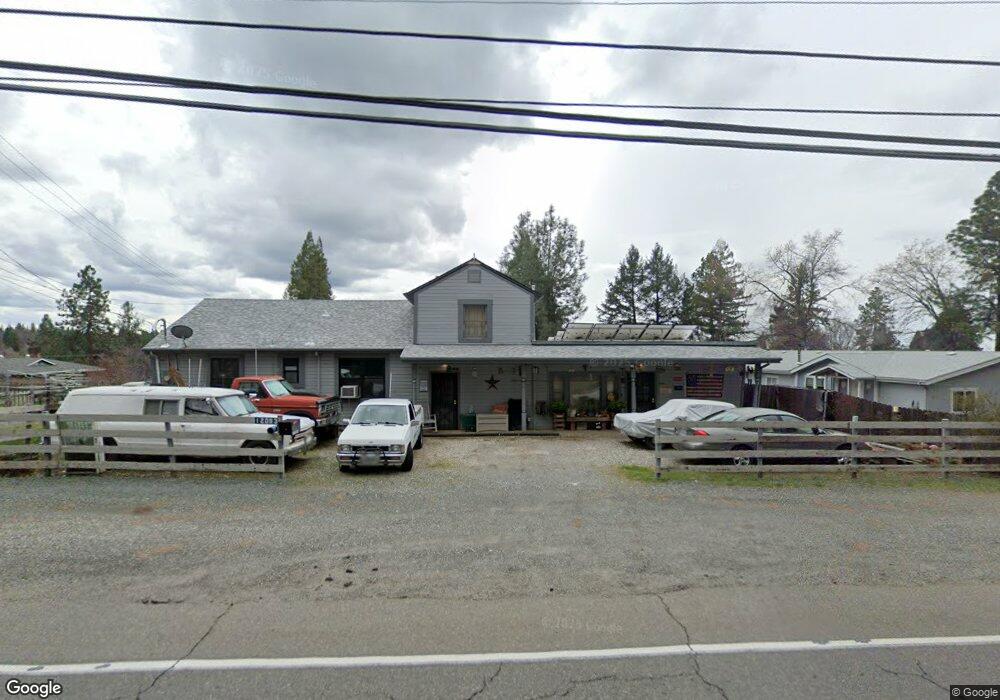
12093 Rough And Ready Hwy Grass Valley, CA 95945
Estimated Value: $356,000 - $440,000
4
Beds
3
Baths
1,925
Sq Ft
$216/Sq Ft
Est. Value
About This Home
This home is located at 12093 Rough And Ready Hwy, Grass Valley, CA 95945 and is currently estimated at $415,186, approximately $215 per square foot. 12093 Rough And Ready Hwy is a home located in Nevada County with nearby schools including Margaret G. Scotten Elementary School, Bell Hill Academy, and Lyman Gilmore Middle School.
Ownership History
Date
Name
Owned For
Owner Type
Purchase Details
Closed on
May 5, 2011
Sold by
Thoman Cornelius C and Thoman Dorothy J
Bought by
Thoman Mark R and Thoman Montesa A
Current Estimated Value
Purchase Details
Closed on
Mar 24, 2004
Sold by
Thoman Cornelius C and Thoman Dorothy J
Bought by
Thoman Cornelius C and Thoman Dorothy J
Home Financials for this Owner
Home Financials are based on the most recent Mortgage that was taken out on this home.
Original Mortgage
$192,500
Interest Rate
5.57%
Mortgage Type
New Conventional
Purchase Details
Closed on
May 21, 1999
Sold by
Thoman Cornelius C and Thoman Dorothy J
Bought by
Thoman Cornelius C and Thoman Dorothy J
Home Financials for this Owner
Home Financials are based on the most recent Mortgage that was taken out on this home.
Original Mortgage
$100,750
Interest Rate
6.86%
Create a Home Valuation Report for This Property
The Home Valuation Report is an in-depth analysis detailing your home's value as well as a comparison with similar homes in the area
Home Values in the Area
Average Home Value in this Area
Purchase History
| Date | Buyer | Sale Price | Title Company |
|---|---|---|---|
| Thoman Mark R | -- | None Available | |
| Thoman Cornelius C | -- | Fidelity National Title Co | |
| Thoman Cornelius C | -- | Inter County Title Co |
Source: Public Records
Mortgage History
| Date | Status | Borrower | Loan Amount |
|---|---|---|---|
| Closed | Thoman Cornelius C | $192,500 | |
| Closed | Thoman Cornelius C | $100,750 |
Source: Public Records
Tax History Compared to Growth
Tax History
| Year | Tax Paid | Tax Assessment Tax Assessment Total Assessment is a certain percentage of the fair market value that is determined by local assessors to be the total taxable value of land and additions on the property. | Land | Improvement |
|---|---|---|---|---|
| 2025 | $436 | $188,538 | $62,532 | $126,006 |
| 2024 | $479 | $184,842 | $61,306 | $123,536 |
| 2023 | $479 | $181,218 | $60,104 | $121,114 |
| 2022 | $556 | $177,666 | $58,926 | $118,740 |
| 2021 | $523 | $174,183 | $57,771 | $116,412 |
| 2020 | $548 | $172,398 | $57,179 | $115,219 |
| 2019 | $540 | $169,018 | $56,058 | $112,960 |
| 2018 | $555 | $165,705 | $54,959 | $110,746 |
| 2017 | $1,923 | $162,457 | $53,882 | $108,575 |
| 2016 | $1,856 | $159,273 | $52,826 | $106,447 |
| 2015 | $1,828 | $156,882 | $52,033 | $104,849 |
| 2014 | $1,800 | $153,810 | $51,014 | $102,796 |
Source: Public Records
Map
Nearby Homes
- 12189 Sunset Ave
- 0 Bitney Springs Rd
- 11254 Squirrel Creek Rd
- 11163 Squirrel Creek Rd
- 10530 Walker Dr
- 10450 S Ponderosa Way
- 10978 Squirrel Creek Rd
- 11360 Rough And Ready Hwy
- 10683 Walker Dr
- 13207 Ridge Rd
- 12423 Lowhills Rd
- 12787 Mystic Mine Rd
- 13356 Mystic Mine Rd
- 13054 Ridge Rd
- 10124 S Ponderosa Way
- 10788 Alta St
- 13006 Ridge Rd
- 46 Wendy Cir
- 116 Independence Ct
- 64 Primrose Ln
- 12111 Rough And Ready Hwy
- 10027 East Dr
- 12063 Rough And Ready Hwy
- 12125 Rough And Ready Hwy
- 10049 East Dr
- 12110 Sunset Ave
- 12043 Rough And Ready Hwy
- 12126 Sunset Ave
- 10052 East Dr
- 10065 East Dr
- 12153 Rough And Ready Hwy
- 12140 Sunset Ave
- 10048 East Dr
- 12021 Rough And Ready Hwy
- 12154 Sunset Ave
- 12167 Rough And Ready Hwy
- 12140 Rough And Ready Hwy