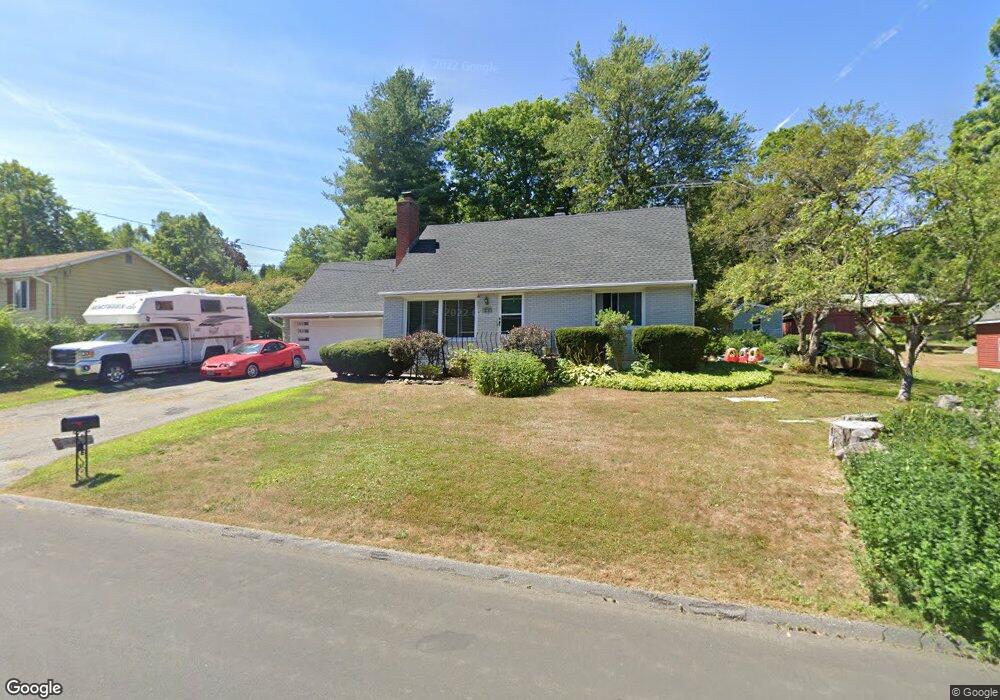
121 Birden St Torrington, CT 06790
Estimated Value: $333,000 - $379,000
4
Beds
2
Baths
1,967
Sq Ft
$178/Sq Ft
Est. Value
About This Home
This home is located at 121 Birden St, Torrington, CT 06790 and is currently estimated at $350,448, approximately $178 per square foot. 121 Birden St is a home located in Litchfield County with nearby schools including Torrington Middle School, Torrington High School, and St. John Paul the Great Academy.
Ownership History
Date
Name
Owned For
Owner Type
Purchase Details
Closed on
Dec 15, 1995
Sold by
Strahan Francis B and Strahan Theresa L
Bought by
Regis Peter and Regis Patricia A
Current Estimated Value
Home Financials for this Owner
Home Financials are based on the most recent Mortgage that was taken out on this home.
Original Mortgage
$72,000
Interest Rate
7.38%
Mortgage Type
Unknown
Create a Home Valuation Report for This Property
The Home Valuation Report is an in-depth analysis detailing your home's value as well as a comparison with similar homes in the area
Home Values in the Area
Average Home Value in this Area
Purchase History
| Date | Buyer | Sale Price | Title Company |
|---|---|---|---|
| Regis Peter | $119,000 | -- |
Source: Public Records
Mortgage History
| Date | Status | Borrower | Loan Amount |
|---|---|---|---|
| Closed | Regis Peter | $26,933 | |
| Closed | Regis Peter | $62,000 | |
| Closed | Regis Peter | $72,000 | |
| Previous Owner | Regis Peter | $41,251 |
Source: Public Records
Tax History Compared to Growth
Tax History
| Year | Tax Paid | Tax Assessment Tax Assessment Total Assessment is a certain percentage of the fair market value that is determined by local assessors to be the total taxable value of land and additions on the property. | Land | Improvement |
|---|---|---|---|---|
| 2025 | $8,855 | $230,300 | $23,800 | $206,500 |
| 2024 | $5,089 | $106,080 | $23,770 | $82,310 |
| 2023 | $5,088 | $106,080 | $23,770 | $82,310 |
| 2022 | $5,001 | $106,080 | $23,770 | $82,310 |
| 2021 | $4,898 | $106,080 | $23,770 | $82,310 |
| 2020 | $4,898 | $106,080 | $23,770 | $82,310 |
| 2019 | $4,983 | $107,930 | $29,200 | $78,730 |
| 2018 | $4,576 | $99,110 | $29,200 | $69,910 |
| 2017 | $4,938 | $107,930 | $29,200 | $78,730 |
| 2016 | $4,938 | $107,930 | $29,200 | $78,730 |
| 2015 | $4,534 | $99,110 | $29,200 | $69,910 |
| 2014 | $4,918 | $135,400 | $44,730 | $90,670 |
Source: Public Records
Map
Nearby Homes
- 0 Highland Ave Unit 24088105
- 58 Eggleston St
- 213 Spring St
- 95 Colorado Ave N
- 91 Riverside Ave
- 77 Chestnut Ave
- 27 Washington Ave
- 244 Hawthorne Terrace
- 23 Berry St
- 7 Ford Ln
- 68 Westledge Terrace
- 121 Culvert St
- 231 Beechwood Ave
- 30 Culvert St
- 8 Bancroft St
- 271 Heights Dr
- 69 McGuinness St
- 118 Pearl St
- 21 Roosevelt Ave
- 149 Turner Ave