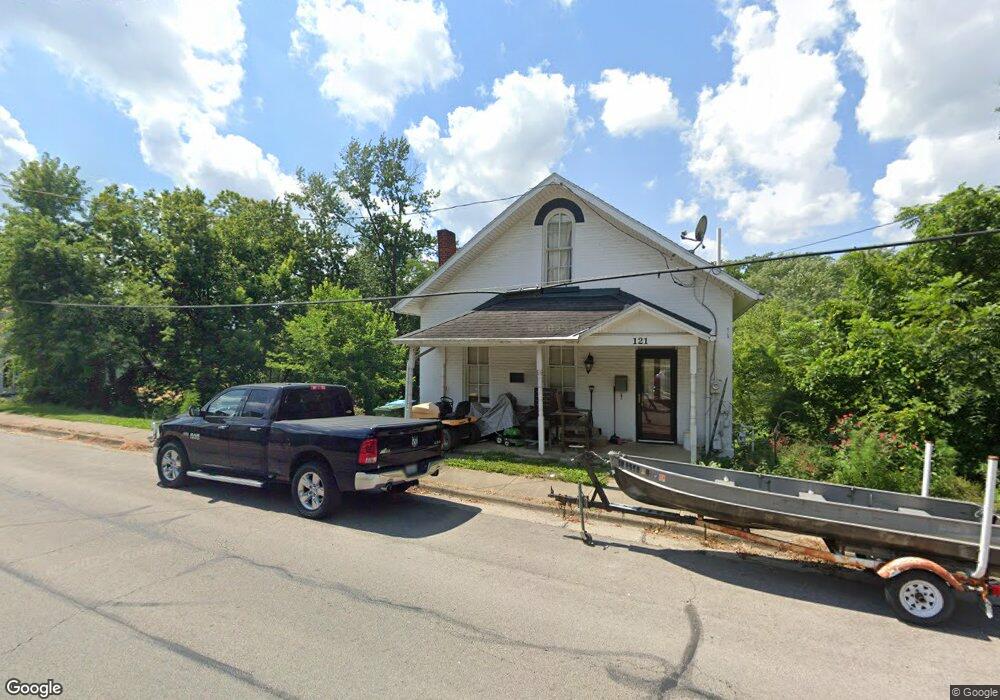
121 Brooklyn Ave Sidney, OH 45365
Estimated Value: $120,399 - $142,000
2
Beds
1
Bath
1,456
Sq Ft
$91/Sq Ft
Est. Value
About This Home
This home is located at 121 Brooklyn Ave, Sidney, OH 45365 and is currently estimated at $132,100, approximately $90 per square foot. 121 Brooklyn Ave is a home located in Shelby County with nearby schools including Sidney High School, Holy Angels Catholic School, and Christian Academy Schools.
Ownership History
Date
Name
Owned For
Owner Type
Purchase Details
Closed on
Feb 5, 2021
Sold by
Sexton Sue E and Schroerlucke Su E
Bought by
Schroerlucke Ronald A
Current Estimated Value
Home Financials for this Owner
Home Financials are based on the most recent Mortgage that was taken out on this home.
Original Mortgage
$65,600
Outstanding Balance
$48,290
Interest Rate
2.7%
Mortgage Type
New Conventional
Estimated Equity
$83,810
Purchase Details
Closed on
Jul 31, 2017
Sold by
Schroerlucke Ronald A and Schroerlucke Sue E
Bought by
Schroerlucke Ronald A and Schroerlucke Sue E
Home Financials for this Owner
Home Financials are based on the most recent Mortgage that was taken out on this home.
Original Mortgage
$52,800
Interest Rate
3.17%
Mortgage Type
New Conventional
Purchase Details
Closed on
Feb 26, 1998
Sold by
Shelby County Historical
Bought by
Schroerlucke Ronald A
Create a Home Valuation Report for This Property
The Home Valuation Report is an in-depth analysis detailing your home's value as well as a comparison with similar homes in the area
Home Values in the Area
Average Home Value in this Area
Purchase History
| Date | Buyer | Sale Price | Title Company |
|---|---|---|---|
| Schroerlucke Ronald A | -- | Hallmark Title Llc | |
| Schroerlucke Ronald A | -- | Hallmark Title | |
| Schroerlucke Ronald A | $19,500 | -- |
Source: Public Records
Mortgage History
| Date | Status | Borrower | Loan Amount |
|---|---|---|---|
| Open | Schroerlucke Ronald A | $65,600 | |
| Closed | Schroerlucke Ronald A | $52,800 |
Source: Public Records
Tax History Compared to Growth
Tax History
| Year | Tax Paid | Tax Assessment Tax Assessment Total Assessment is a certain percentage of the fair market value that is determined by local assessors to be the total taxable value of land and additions on the property. | Land | Improvement |
|---|---|---|---|---|
| 2024 | $600 | $25,180 | $5,830 | $19,350 |
| 2023 | $600 | $25,180 | $5,830 | $19,350 |
| 2022 | $805 | $18,710 | $5,050 | $13,660 |
| 2021 | $814 | $18,710 | $5,050 | $13,660 |
| 2020 | $812 | $18,710 | $5,050 | $13,660 |
| 2019 | $717 | $16,280 | $4,270 | $12,010 |
| 2018 | $681 | $15,840 | $4,270 | $11,570 |
| 2017 | $622 | $15,840 | $4,270 | $11,570 |
| 2016 | $511 | $12,970 | $4,270 | $8,700 |
| 2015 | $512 | $12,970 | $4,270 | $8,700 |
| 2014 | $512 | $12,970 | $4,270 | $8,700 |
| 2013 | $570 | $13,350 | $4,270 | $9,080 |
Source: Public Records
Map
Nearby Homes
- 115 Brooklyn Ave
- 413 E Poplar St
- 414 & 416 E Court St
- 803 Dingman St
- 807 Dingman St
- 321 Oldham Ave
- 105 N Ohio Ave Unit C
- 107 N Ohio Ave Unit C
- 315 Washington St
- 109 E Water St
- 420 S Ohio Ave
- 119 & 121 W Water St
- 608 S Ohio Ave
- 620 S Ohio Ave
- 804 N Miami Ave
- 131 Mound St
- 330 S Walnut Ave
- 808 N Main Ave
- 209 Pike St
- 104 S Pomeroy Ave
- 100 Brooklyn Ave
- 92 Brooklyn Ave
- 118 Brooklyn Ave
- 111 Brooklyn Ave
- 82 Brooklyn Ave
- 122 Brooklyn Ave
- 129 Brooklyn Ave
- 109 Hill St
- 101 Hill St
- 130 Brooklyn Ave
- 131 Brooklyn Ave
- 437 E Poplar St
- 437 E Poplar St
- 521 E North St
- 435 E Poplar St
- 72 Brooklyn Ave
- 136 Brooklyn Ave
- 135 Brooklyn Ave
- 140 Brooklyn Ave
- 116 Hill St