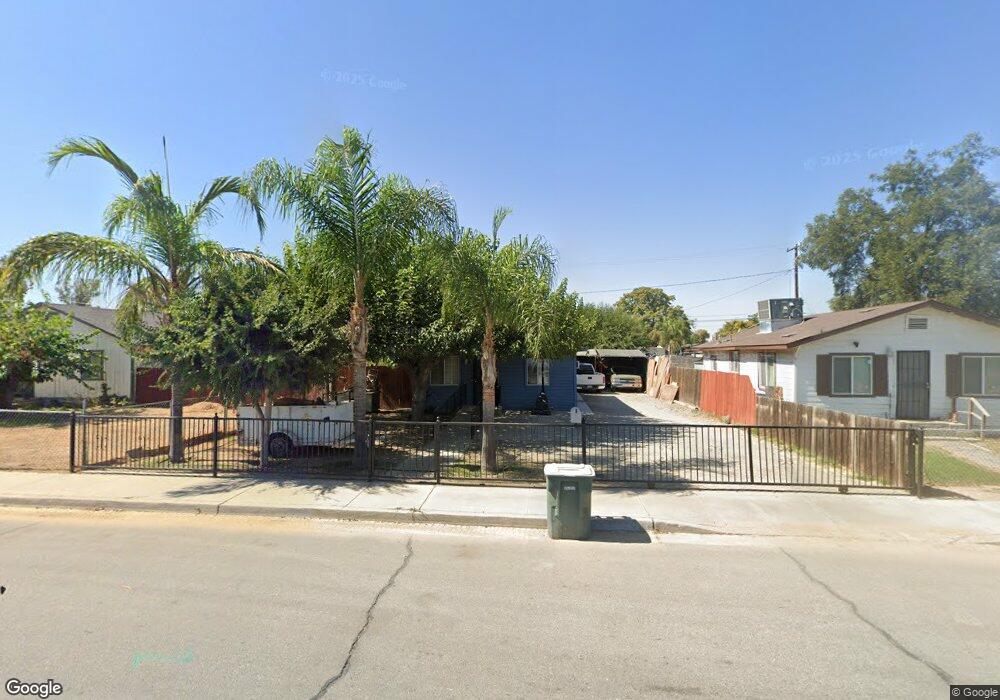
121 Browning Rd Mc Farland, CA 93250
Estimated Value: $128,000 - $230,000
2
Beds
1
Bath
616
Sq Ft
$256/Sq Ft
Est. Value
About This Home
This home is located at 121 Browning Rd, Mc Farland, CA 93250 and is currently estimated at $157,453, approximately $255 per square foot. 121 Browning Rd is a home located in Kern County with nearby schools including McFarland High School.
Ownership History
Date
Name
Owned For
Owner Type
Purchase Details
Closed on
Oct 25, 2024
Sold by
Lopez Vickie
Bought by
Lopez Richard R
Current Estimated Value
Purchase Details
Closed on
Feb 28, 2019
Sold by
Perez Facundo Ruiz and Ruiz Emelia Trejo
Bought by
Perez Facundo Ruiz and Ruiz Emelia Trejo
Purchase Details
Closed on
Oct 2, 2009
Sold by
Bac Home Loan Servicing Lp
Bought by
Ruiz Facundo
Purchase Details
Closed on
Jun 18, 2009
Sold by
Lopez Louis and Lopez Norma
Bought by
Bac Home Loans Servicing Lp and Countrywide Home Loans Servicing Lp
Purchase Details
Closed on
Mar 11, 2004
Sold by
Lopez Richard R and Lopez Victoria M
Bought by
Lopez Louis
Purchase Details
Closed on
Mar 23, 1995
Sold by
Mclaughlin Robert J and Mclaughlin Sharon R
Bought by
Lopez Richard R
Home Financials for this Owner
Home Financials are based on the most recent Mortgage that was taken out on this home.
Original Mortgage
$26,000
Interest Rate
8.81%
Mortgage Type
Seller Take Back
Create a Home Valuation Report for This Property
The Home Valuation Report is an in-depth analysis detailing your home's value as well as a comparison with similar homes in the area
Home Values in the Area
Average Home Value in this Area
Purchase History
| Date | Buyer | Sale Price | Title Company |
|---|---|---|---|
| Lopez Richard R | -- | None Listed On Document | |
| Perez Facundo Ruiz | -- | None Available | |
| Ruiz Facundo | $35,000 | Chicago Title Company | |
| Bac Home Loans Servicing Lp | $42,925 | Landsafe Title | |
| Lopez Louis | $50,000 | First American Title | |
| Lopez Richard R | $27,000 | Chicago Title Company |
Source: Public Records
Mortgage History
| Date | Status | Borrower | Loan Amount |
|---|---|---|---|
| Previous Owner | Lopez Richard R | $26,000 |
Source: Public Records
Tax History Compared to Growth
Tax History
| Year | Tax Paid | Tax Assessment Tax Assessment Total Assessment is a certain percentage of the fair market value that is determined by local assessors to be the total taxable value of land and additions on the property. | Land | Improvement |
|---|---|---|---|---|
| 2025 | $694 | $45,164 | $25,809 | $19,355 |
| 2024 | $679 | $44,279 | $25,303 | $18,976 |
| 2023 | $679 | $43,411 | $24,807 | $18,604 |
| 2022 | $658 | $42,561 | $24,321 | $18,240 |
| 2021 | $598 | $41,728 | $23,845 | $17,883 |
| 2020 | $566 | $41,301 | $23,601 | $17,700 |
| 2019 | $537 | $41,301 | $23,601 | $17,700 |
| 2018 | $531 | $39,699 | $22,686 | $17,013 |
| 2017 | $519 | $38,922 | $22,242 | $16,680 |
| 2016 | $513 | $38,159 | $21,806 | $16,353 |
| 2015 | $505 | $37,587 | $21,479 | $16,108 |
| 2014 | $486 | $36,852 | $21,059 | $15,793 |
Source: Public Records
Map
Nearby Homes
- 254 E Sherwood Ave
- 148 San Lucas St
- 0 E Sherwood Ave
- 276 San Juan St
- 389 Mount Arbor St
- 249 Robertson Ave
- 124 4th Place
- 0 W Sherwood Ave Unit 202506495
- 0 W Sherwood Ave Unit 21453658
- 805 Price St
- 836 Fletcher St
- 314 8th St
- 852 Butte St
- 830 Davis Ave
- 450 8th St
- 583 Taylor Ave
- 737 Misty Ave
- 1085 Mast Ave
- 733 Ensenata Dr
- 539 11th St
- 125 Browning Rd
- 115 Browning Rd
- 133 Browning Rd
- 124 San Juan St
- 141 Browning Rd
- 140 San Juan St
- 108 San Juan St
- 148 San Juan St
- 124 Browning Rd
- 149 Browning Rd
- 132 Browning Rd
- 116 Browning Rd
- 140 Browning Rd
- 156 San Juan St
- 100 Browning Rd
- 157 Browning Rd
- 156 Browning Rd
- 125 San Juan St
- 161 Browning Rd
- 133 San Juan St