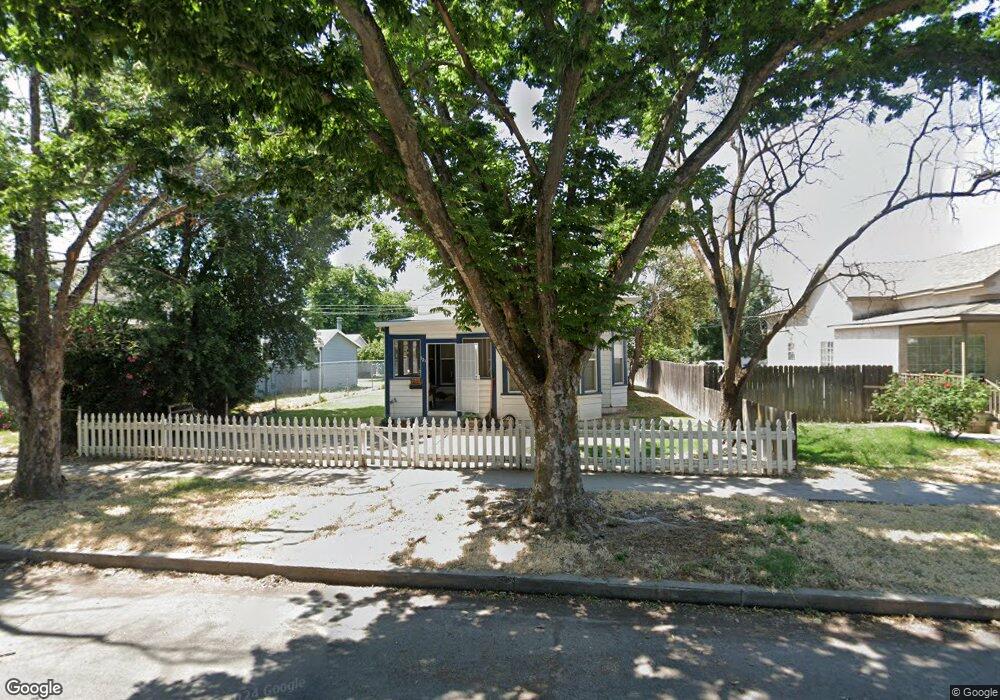
121 Clay St Colusa, CA 95932
Estimated Value: $195,000 - $1,400,269
2
Beds
1
Bath
822
Sq Ft
$655/Sq Ft
Est. Value
About This Home
This home is located at 121 Clay St, Colusa, CA 95932 and is currently estimated at $538,817, approximately $655 per square foot. 121 Clay St is a home located in Colusa County with nearby schools including James M. Burchfield Primary School, George T. Egling Middle School, and Colusa High School.
Ownership History
Date
Name
Owned For
Owner Type
Purchase Details
Closed on
Apr 29, 2020
Sold by
Gross Jared J and Gross Loni M
Bought by
Grand Island Properties Llc
Current Estimated Value
Purchase Details
Closed on
Jun 18, 2018
Sold by
J & R Kafsbeek Inc
Bought by
Gross Jared J and Gross Loni M
Home Financials for this Owner
Home Financials are based on the most recent Mortgage that was taken out on this home.
Original Mortgage
$135,000
Outstanding Balance
$116,752
Interest Rate
4.5%
Mortgage Type
New Conventional
Estimated Equity
$422,065
Purchase Details
Closed on
Sep 25, 2017
Sold by
Pearson Gwen and The C & G Pearson Family Trust
Bought by
Gross Jared J and Gross Loni M
Purchase Details
Closed on
Oct 5, 2011
Sold by
Pearson Charles E and Pearson Gwen G
Bought by
Pearson Charles E and Pearson Gwen
Create a Home Valuation Report for This Property
The Home Valuation Report is an in-depth analysis detailing your home's value as well as a comparison with similar homes in the area
Home Values in the Area
Average Home Value in this Area
Purchase History
| Date | Buyer | Sale Price | Title Company |
|---|---|---|---|
| Grand Island Properties Llc | -- | None Available | |
| Gross Jared J | $973,000 | None Available | |
| Gross Jared J | $69,000 | First American Title Company | |
| Pearson Charles E | -- | None Available |
Source: Public Records
Mortgage History
| Date | Status | Borrower | Loan Amount |
|---|---|---|---|
| Open | Gross Jared J | $135,000 |
Source: Public Records
Tax History Compared to Growth
Tax History
| Year | Tax Paid | Tax Assessment Tax Assessment Total Assessment is a certain percentage of the fair market value that is determined by local assessors to be the total taxable value of land and additions on the property. | Land | Improvement |
|---|---|---|---|---|
| 2025 | $990 | $78,504 | $39,821 | $38,683 |
| 2024 | $990 | $76,966 | $39,041 | $37,925 |
| 2023 | $937 | $75,458 | $38,276 | $37,182 |
| 2022 | $930 | $73,979 | $37,526 | $36,453 |
| 2021 | $891 | $72,530 | $36,791 | $35,739 |
| 2020 | $880 | $71,787 | $36,414 | $35,373 |
| 2019 | $868 | $70,380 | $35,700 | $34,680 |
| 2018 | $861 | $69,000 | $35,000 | $34,000 |
| 2017 | $644 | $47,502 | $23,751 | $23,751 |
| 2016 | $627 | $46,572 | $23,286 | $23,286 |
| 2015 | $615 | $45,874 | $22,937 | $22,937 |
| 2014 | $591 | $44,976 | $22,488 | $22,488 |
Source: Public Records
Map
Nearby Homes
- 6 Oak St
- 35 Parkhill St
- 30 Webster St
- 345 Fremont St
- 0 E Carson St Unit 225122408
- 738 Webster St
- 931 Clay St
- 0 Ware Ave
- 230 10th St
- 1425 5th St
- 1111 Fremont St
- 1732 Wescott Rd
- 0 14th St
- 1450 Lake Ave Unit 6
- 30 Walnut Tree Dr
- 0 Sanborn Dr
- 509 Voyager Ct
- 53 Walnut Tree Dr
- 442 Kittyhawk Rd
- 90 King Air Dr