Estimated Value: $446,620 - $479,000
3
Beds
2
Baths
1,567
Sq Ft
$296/Sq Ft
Est. Value
About This Home
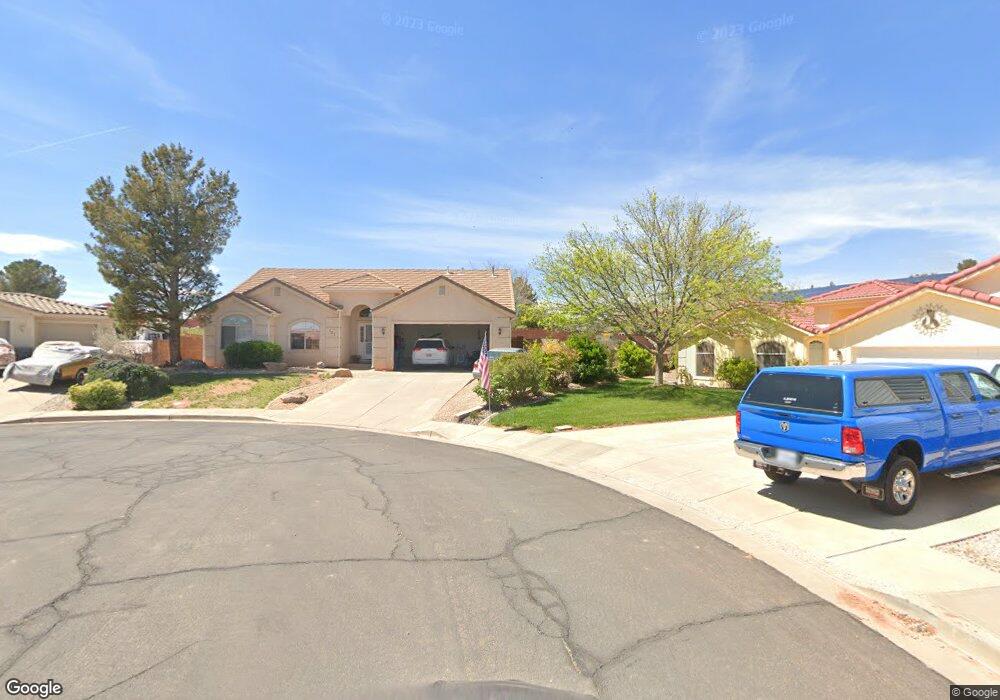
This home is located at 121 E 755 S, Ivins, UT 84738 and is currently estimated at $463,405, approximately $295 per square foot. 121 E 755 S is a home located in Washington County with nearby schools including Red Mountain School, Snow Canyon Middle School, and Lava Ridge Intermediate School.
Ownership History
Date
Name
Owned For
Owner Type
Purchase Details
Closed on
Jan 16, 2020
Sold by
Butler Dennis and The Dennis Butler Family Trust
Bought by
Robison Mark and Robison Lisa
Current Estimated Value
Home Financials for this Owner
Home Financials are based on the most recent Mortgage that was taken out on this home.
Original Mortgage
$267,676
Outstanding Balance
$236,502
Interest Rate
3.6%
Mortgage Type
New Conventional
Estimated Equity
$226,903
Purchase Details
Closed on
Mar 9, 2016
Sold by
Butler Dennis B
Bought by
Butler Dennis B and Dennis Butler Family Trust
Purchase Details
Closed on
Jan 28, 2013
Sold by
Butler Dennis
Bought by
Butler Dennis B and The Dennis B Butler Inter Vivos Otip Tru
Purchase Details
Closed on
Dec 11, 2012
Sold by
Us Bank Na
Bought by
Butler Dennis
Purchase Details
Closed on
Aug 7, 2012
Sold by
Ross Jared and Ross Laura
Bought by
Us Bank Na and Structured Asset Securities Corp
Create a Home Valuation Report for This Property
The Home Valuation Report is an in-depth analysis detailing your home's value as well as a comparison with similar homes in the area
Purchase History
| Date | Buyer | Sale Price | Title Company |
|---|---|---|---|
| Robison Mark | -- | Terra Title Company | |
| Butler Dennis B | -- | None Available | |
| Butler Dennis B | -- | None Available | |
| Butler Dennis | -- | Servicelink Aliquippa Title | |
| Us Bank Na | $120,000 | Trustees Title & Escrow |
Source: Public Records
Mortgage History
| Date | Status | Borrower | Loan Amount |
|---|---|---|---|
| Open | Robison Mark | $267,676 |
Source: Public Records
Tax History
| Year | Tax Paid | Tax Assessment Tax Assessment Total Assessment is a certain percentage of the fair market value that is determined by local assessors to be the total taxable value of land and additions on the property. | Land | Improvement |
|---|---|---|---|---|
| 2025 | $1,611 | $238,480 | $74,250 | $164,230 |
| 2023 | $1,661 | $243,375 | $63,250 | $180,125 |
| 2022 | $1,687 | $232,705 | $57,750 | $174,955 |
| 2021 | $1,550 | $317,700 | $70,000 | $247,700 |
| 2020 | $1,358 | $263,300 | $65,000 | $198,300 |
| 2019 | $1,361 | $258,100 | $50,000 | $208,100 |
| 2018 | $1,244 | $118,140 | $0 | $0 |
| 2017 | $1,152 | $109,340 | $0 | $0 |
| 2016 | $1,205 | $105,710 | $0 | $0 |
| 2015 | $1,201 | $101,420 | $0 | $0 |
| 2014 | $1,081 | $91,740 | $0 | $0 |
Source: Public Records
Map
Nearby Homes
- 76 E 725 S
- 699 S 160 E
- 223 E 800 S
- 103 E Morning Glory Ave
- 915 S 170 E
- 37 W Serenity Cir
- 23 E Morning Glory Ave
- 244 E 580 S
- 557 Harmony Cir
- 256 E 580 S
- 562 S Harmony Cir
- 668 S 315 E Unit 45
- 565 S 250 E
- 61 E 490 S
- 334 E 615 S Unit 17
- 133 Terrace Ln
- 362 E 680 S Unit 52
- 191 W 685 S
- 312 E Desert Rose Way
- 375 E 615 S
Your Personal Tour Guide
Ask me questions while you tour the home.