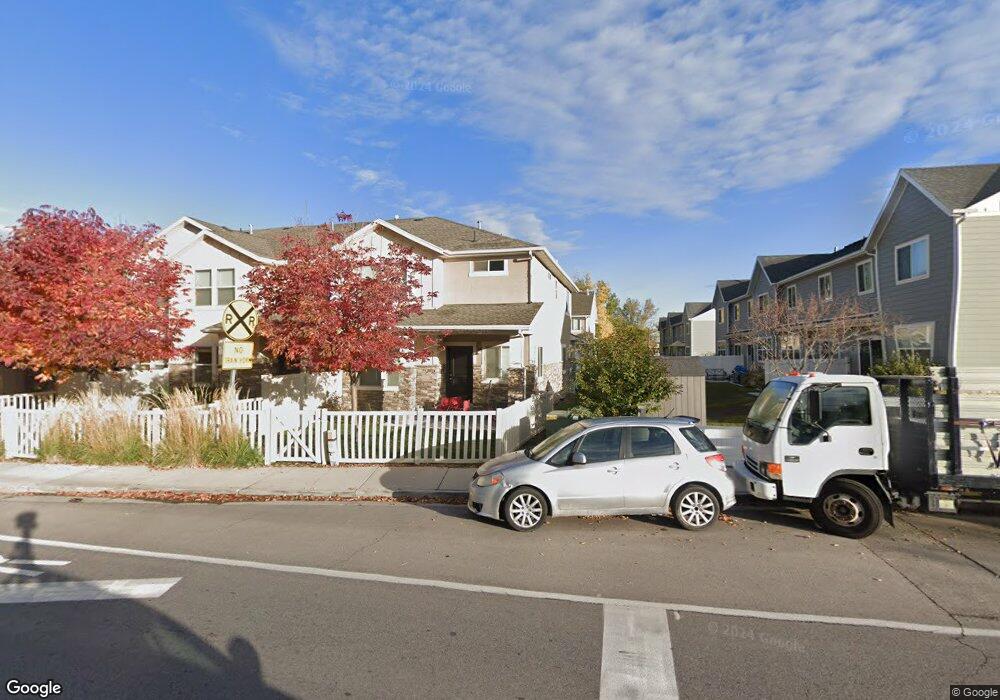
121 E 8000 S Midvale, UT 84070
Estimated Value: $455,000 - $552,000
3
Beds
3
Baths
1,573
Sq Ft
$320/Sq Ft
Est. Value
About This Home
This home is available for showing 5th of September 2024
Freshly painted and new carpeting. One car garage and outdoor parking space. Covered patio space and fenced. Shared community basketball court. Easy walking to public transit and waking distance to the Midvale elementary and union middle school.
Ownership History
Date
Name
Owned For
Owner Type
Purchase Details
Closed on
Mar 16, 2015
Sold by
Broadwalk Industries 8000 Llc
Bought by
Dsj Properties Llc
Current Estimated Value
Create a Home Valuation Report for This Property
The Home Valuation Report is an in-depth analysis detailing your home's value as well as a comparison with similar homes in the area
Home Values in the Area
Average Home Value in this Area
Purchase History
| Date | Buyer | Sale Price | Title Company |
|---|---|---|---|
| Dsj Properties Llc | -- | United Title Services |
Source: Public Records
Property History
| Date | Event | Price | List to Sale | Price per Sq Ft |
|---|---|---|---|---|
| 10/22/2024 10/22/24 | Off Market | $2,150 | -- | -- |
| 10/08/2024 10/08/24 | Off Market | $2,150 | -- | -- |
| 09/28/2024 09/28/24 | For Rent | $2,150 | 0.0% | -- |
| 12/06/2022 12/06/22 | For Rent | $2,150 | -- | -- |
Tax History Compared to Growth
Tax History
| Year | Tax Paid | Tax Assessment Tax Assessment Total Assessment is a certain percentage of the fair market value that is determined by local assessors to be the total taxable value of land and additions on the property. | Land | Improvement |
|---|---|---|---|---|
| 2025 | $2,877 | $485,600 | $53,800 | $431,800 |
| 2024 | $2,877 | $472,300 | $50,600 | $421,700 |
| 2023 | $2,673 | $434,800 | $48,100 | $386,700 |
| 2022 | $2,800 | $445,000 | $47,200 | $397,800 |
| 2021 | $2,496 | $339,100 | $41,000 | $298,100 |
| 2020 | $2,352 | $302,400 | $33,200 | $269,200 |
| 2019 | $2,325 | $291,300 | $33,200 | $258,100 |
| 2016 | $1,987 | $234,600 | $40,200 | $194,400 |
Source: Public Records
Map
Nearby Homes
- 135 E Station St
- Gomez The Mill Plan at The Mill
- 257 E Water Mill Way
- 257 Water Mill Way Unit 211
- 274 E Water Mill Way Unit 230
- 74 E Resaca Dr Unit B12
- 8264 S Resaca Dr Unit K9
- 8264 S Resaca Dr Unit K4
- 7824 S 280 E
- 139 E Abbeville Ct
- 125 E 7660 St S Unit 102
- 121 E 7660 St S Unit 101
- 7994 Roosevelt St
- 8218 S Coolidge St
- 139 W Columbia Dr
- 218 E 7615 S
- 120 E 7615 St S Unit 103
- 133 E 7615 S
- 7359 S Dewmar Ct W Unit 32
- 7352 S Dewmar Ct W Unit 43
- 123 E 8000 S Unit 3
- 129 E 8000 S
- 131 E 8000 S
- 7980 S Pinstripe Cove
- 7972 S Pinstripe Cove
- 7988 S Pinstripe Cove
- 109 E 8000 S
- 7964 S Pinstripe Cove
- 115 E 8000 S Unit 2
- 113 E 8000 S
- 107 E 8000 S Unit 1
- 105 E 8000 S
- 101 E 8000 S
- 103 E 8000 S
- 101 E 8000 S
- 103 E 8000 S
- 97 E 8000 S
- 97 E 8000 S
- 139 E 8000 S
- 95 E 8000 S