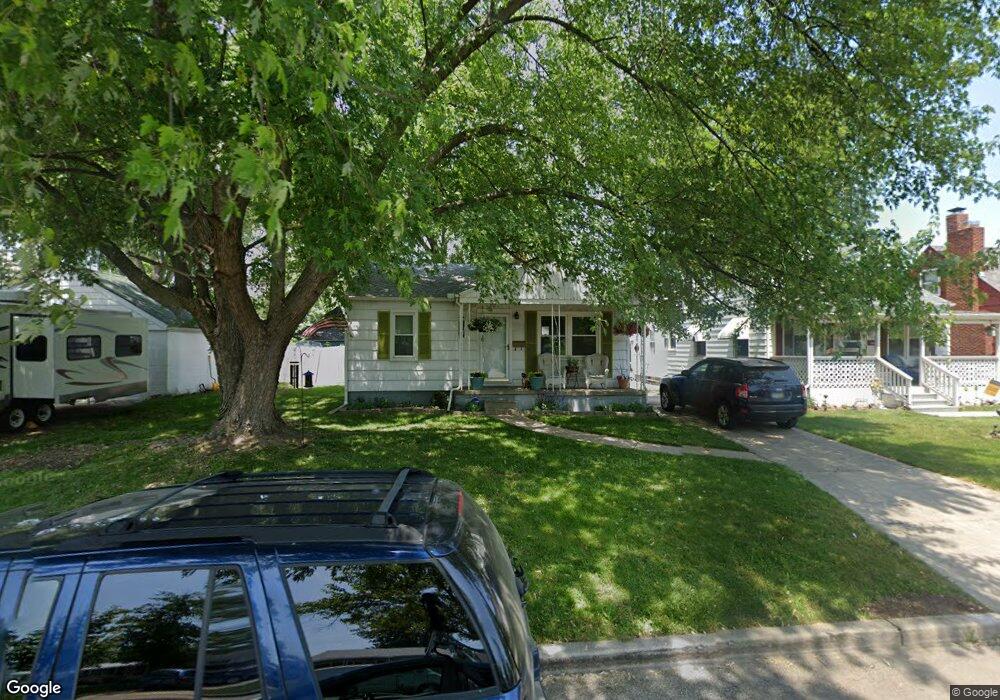
121 E Northgate Pkwy Toledo, OH 43612
North Towne NeighborhoodEstimated Value: $97,000 - $118,000
2
Beds
1
Bath
725
Sq Ft
$146/Sq Ft
Est. Value
About This Home
This home is located at 121 E Northgate Pkwy, Toledo, OH 43612 and is currently estimated at $105,503, approximately $145 per square foot. 121 E Northgate Pkwy is a home located in Lucas County with nearby schools including Greenwood Elementary School, Washington Junior High School, and Jefferson Junior High School.
Ownership History
Date
Name
Owned For
Owner Type
Purchase Details
Closed on
Jul 15, 2010
Sold by
Fannie Mae
Bought by
Mcelwain Raymond and Mcelwain Dana
Current Estimated Value
Purchase Details
Closed on
Jan 29, 2010
Sold by
Sothen Bradford L
Bought by
Federal National Mortgage Association
Purchase Details
Closed on
May 13, 2004
Sold by
Mohr Darryl and Mohr Kelly
Bought by
Sothen Bradford L
Home Financials for this Owner
Home Financials are based on the most recent Mortgage that was taken out on this home.
Original Mortgage
$78,370
Interest Rate
5.63%
Mortgage Type
Purchase Money Mortgage
Purchase Details
Closed on
Jan 17, 2004
Sold by
Cependa Thomas E and Cependa Kimberly M
Bought by
Mohr Darryl and Mohr Kelly
Purchase Details
Closed on
Aug 6, 1999
Sold by
Dusa James R and Dusa Laurie M
Bought by
Cependa Thomas E and Cependa Kimberly M
Home Financials for this Owner
Home Financials are based on the most recent Mortgage that was taken out on this home.
Original Mortgage
$58,626
Interest Rate
7.68%
Mortgage Type
FHA
Purchase Details
Closed on
Apr 22, 1993
Sold by
Dusa Ii James R
Purchase Details
Closed on
Aug 15, 1991
Sold by
Young Robert A
Create a Home Valuation Report for This Property
The Home Valuation Report is an in-depth analysis detailing your home's value as well as a comparison with similar homes in the area
Home Values in the Area
Average Home Value in this Area
Purchase History
| Date | Buyer | Sale Price | Title Company |
|---|---|---|---|
| Mcelwain Raymond | $25,400 | Accutitle Agency Inc | |
| Federal National Mortgage Association | $50,000 | None Available | |
| Sothen Bradford L | $82,500 | -- | |
| Mohr Darryl | $63,751 | -- | |
| Cependa Thomas E | $59,400 | -- | |
| -- | -- | -- | |
| -- | $44,500 | -- |
Source: Public Records
Mortgage History
| Date | Status | Borrower | Loan Amount |
|---|---|---|---|
| Previous Owner | Sothen Bradford L | $78,370 | |
| Previous Owner | Cependa Thomas E | $58,626 |
Source: Public Records
Tax History
| Year | Tax Paid | Tax Assessment Tax Assessment Total Assessment is a certain percentage of the fair market value that is determined by local assessors to be the total taxable value of land and additions on the property. | Land | Improvement |
|---|---|---|---|---|
| 2025 | -- | $27,895 | $10,570 | $17,325 |
| 2024 | $877 | $27,895 | $10,570 | $17,325 |
| 2023 | $1,441 | $19,285 | $8,505 | $10,780 |
| 2022 | $1,410 | $19,285 | $8,505 | $10,780 |
| 2021 | $1,434 | $19,285 | $8,505 | $10,780 |
| 2020 | $1,403 | $16,135 | $7,070 | $9,065 |
| 2019 | $1,358 | $16,135 | $7,070 | $9,065 |
| 2018 | $1,244 | $16,135 | $7,070 | $9,065 |
| 2017 | $1,236 | $14,980 | $5,600 | $9,380 |
| 2016 | $1,240 | $42,800 | $16,000 | $26,800 |
| 2015 | $1,238 | $42,800 | $16,000 | $26,800 |
| 2014 | $1,021 | $14,980 | $5,600 | $9,380 |
| 2013 | $1,021 | $14,980 | $5,600 | $9,380 |
Source: Public Records
Map
Nearby Homes
- 221 Orville Dr
- 326 Orville Dr
- 7 E Capistrano Ave
- 47 W Crawford Ave
- 533 W Northgate Pkwy
- 223 W Capistrano Ave
- 331 W Crawford Ave
- 540 Cloverdale Rd
- 702 Mayfair Blvd
- 736 W Northgate Pkwy
- 5862 W Benalex Dr
- 433 California Blvd
- 218 Waggoner Blvd
- 840 Southover Rd
- 334 Waggoner Blvd
- 6115 Benalex Dr
- 706 W Gramercy Ave
- 539 Sunset Blvd
- 4703 Vermaas Ave
- 815 W Capistrano Ave
- 125 E Northgate Pkwy
- 113 E Northgate Pkwy
- 129 E Northgate Pkwy
- 109 E Northgate Pkwy
- 133 E Northgate Pkwy
- 122 Orville Dr
- 126 Orville Dr
- 116 Orville Dr
- 130 Orville Dr
- 105 E Northgate Pkwy
- 110 Orville Dr
- 134 Orville Dr
- 106 Orville Dr
- 118 E Northgate Pkwy
- 126 E Northgate Pkwy
- 101 E Northgate Pkwy
- 114 E Northgate Pkwy
- 130 E Northgate Pkwy
- 201 E Northgate Pkwy
- 102 Orville Dr
Your Personal Tour Guide
Ask me questions while you tour the home.