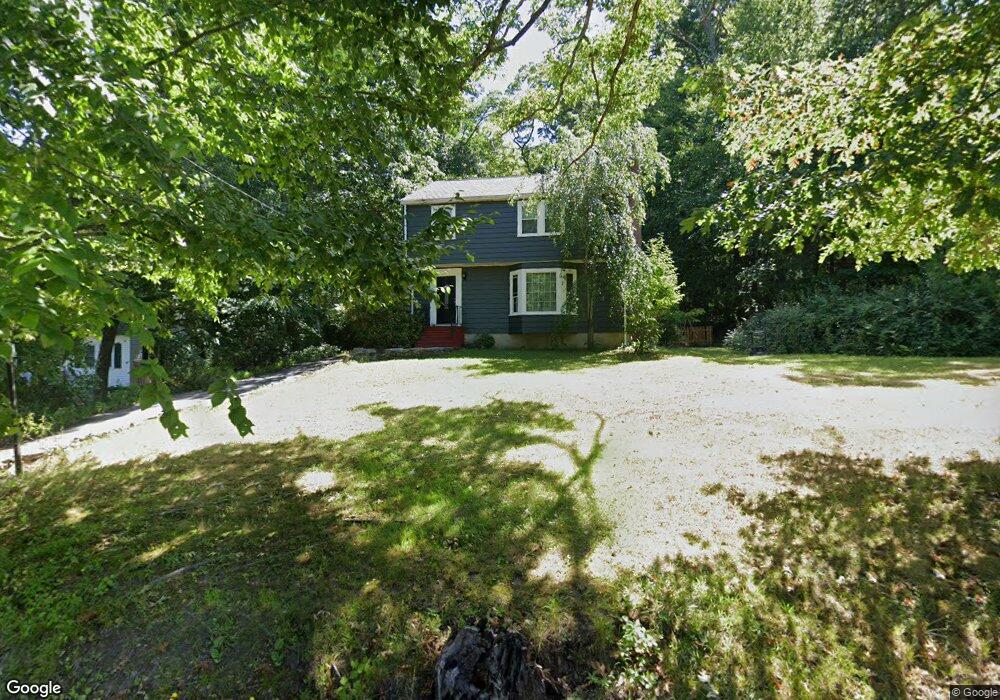
121 Fowler Rd Northbridge, MA 01534
Estimated Value: $467,820 - $558,000
3
Beds
2
Baths
2,084
Sq Ft
$244/Sq Ft
Est. Value
About This Home
This home is located at 121 Fowler Rd, Northbridge, MA 01534 and is currently estimated at $507,705, approximately $243 per square foot. 121 Fowler Rd is a home located in Worcester County with nearby schools including Northbridge Elementary School, Northbridge Middle School, and Northbridge High School.
Ownership History
Date
Name
Owned For
Owner Type
Purchase Details
Closed on
Aug 24, 2004
Sold by
Dodge N P and Foglia Robert L
Bought by
Criasia Lani and Criasia Robert
Current Estimated Value
Home Financials for this Owner
Home Financials are based on the most recent Mortgage that was taken out on this home.
Original Mortgage
$235,000
Outstanding Balance
$115,939
Interest Rate
6.03%
Mortgage Type
Purchase Money Mortgage
Estimated Equity
$391,766
Purchase Details
Closed on
Oct 31, 1996
Sold by
Plouffe Gerald A and Plouffe Constance
Bought by
Foglia Robert L and Foglia Andrea
Purchase Details
Closed on
Apr 16, 1991
Sold by
Hovey James D and Hovey Wendy
Bought by
Plouffe Gerald A and Plouffe Constance
Create a Home Valuation Report for This Property
The Home Valuation Report is an in-depth analysis detailing your home's value as well as a comparison with similar homes in the area
Home Values in the Area
Average Home Value in this Area
Purchase History
| Date | Buyer | Sale Price | Title Company |
|---|---|---|---|
| Criasia Lani | $310,000 | -- | |
| Criasia Lani | $310,000 | -- | |
| Dodge N P | $310,000 | -- | |
| Foglia Robert L | $150,000 | -- | |
| Foglia Robert L | $150,000 | -- | |
| Plouffe Gerald A | $127,000 | -- | |
| Plouffe Gerald A | $127,000 | -- |
Source: Public Records
Mortgage History
| Date | Status | Borrower | Loan Amount |
|---|---|---|---|
| Open | Criasia Lani | $235,000 | |
| Closed | Plouffe Gerald A | $235,000 | |
| Previous Owner | Plouffe Gerald A | $49,687 |
Source: Public Records
Tax History
| Year | Tax Paid | Tax Assessment Tax Assessment Total Assessment is a certain percentage of the fair market value that is determined by local assessors to be the total taxable value of land and additions on the property. | Land | Improvement |
|---|---|---|---|---|
| 2025 | $4,775 | $405,000 | $137,300 | $267,700 |
| 2024 | $4,629 | $382,900 | $137,300 | $245,600 |
| 2023 | $4,720 | $364,200 | $137,300 | $226,900 |
| 2022 | $4,336 | $314,900 | $105,600 | $209,300 |
| 2021 | $4,195 | $289,500 | $100,500 | $189,000 |
| 2020 | $4,891 | $281,100 | $100,500 | $180,600 |
| 2019 | $4,546 | $269,600 | $100,500 | $169,100 |
| 2018 | $3,345 | $258,500 | $95,700 | $162,800 |
| 2017 | $3,964 | $245,900 | $95,700 | $150,200 |
| 2016 | $3,179 | $231,200 | $87,000 | $144,200 |
| 2015 | $3,093 | $231,200 | $87,000 | $144,200 |
| 2014 | $3,066 | $231,200 | $87,000 | $144,200 |
Source: Public Records
Map
Nearby Homes
- 2248 Providence Rd
- 69-71 Providence Rd
- 2294 Providence Rd
- 35 School St Unit 35
- 0 Emond St Unit 1
- 0 Emond St Unit 73480228
- 2428-2430 Providence Rd
- 5 S Main St
- 24 Mcquades Ln
- 220 Alana Dr
- 659 Highland St
- 240 Roosevelt Dr
- 90 Windstone Dr
- 86 Mikes Way Unit 86
- 1825 Quaker St
- 0 Puddon St
- 86 Kingsnorth St
- 81 Rebecca Rd
- 99 W River St
- 7 Central Turnpike
Your Personal Tour Guide
Ask me questions while you tour the home.