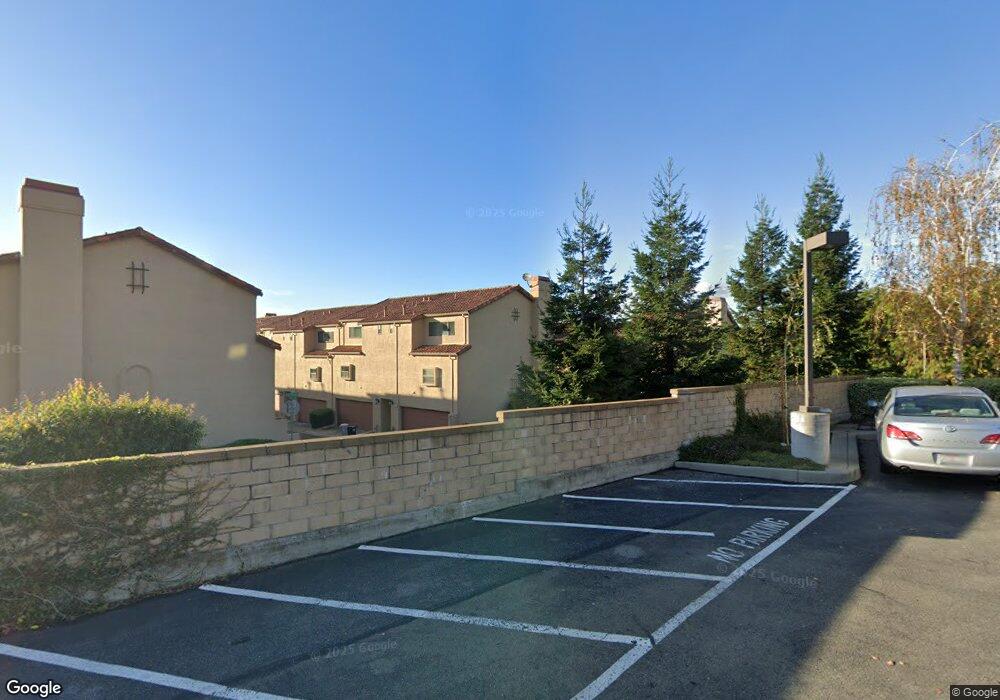
121 Gralina Terrace Fremont, CA 94539
Mission San Jose NeighborhoodEstimated Value: $1,103,615 - $1,491,000
3
Beds
3
Baths
1,460
Sq Ft
$873/Sq Ft
Est. Value
About This Home
This home is located at 121 Gralina Terrace, Fremont, CA 94539 and is currently estimated at $1,273,904, approximately $872 per square foot. 121 Gralina Terrace is a home located in Alameda County with nearby schools including Mission San Jose Elementary School, William Hopkins Junior High School, and Mission San Jose High School.
Ownership History
Date
Name
Owned For
Owner Type
Purchase Details
Closed on
Nov 18, 2021
Sold by
John Lillie Jr Homer
Bought by
Homer John Lillie Jr And Margaret Ann Lillie and Lillie Marga
Current Estimated Value
Purchase Details
Closed on
Dec 10, 1998
Sold by
Lillie Homer J and Lillie Margaret
Bought by
Lillie Homer John and Lillie Margaret Ann
Create a Home Valuation Report for This Property
The Home Valuation Report is an in-depth analysis detailing your home's value as well as a comparison with similar homes in the area
Home Values in the Area
Average Home Value in this Area
Purchase History
| Date | Buyer | Sale Price | Title Company |
|---|---|---|---|
| Homer John Lillie Jr And Margaret Ann Lillie | -- | -- | |
| Lillie Homer John | -- | -- |
Source: Public Records
Tax History Compared to Growth
Tax History
| Year | Tax Paid | Tax Assessment Tax Assessment Total Assessment is a certain percentage of the fair market value that is determined by local assessors to be the total taxable value of land and additions on the property. | Land | Improvement |
|---|---|---|---|---|
| 2025 | $3,912 | $284,366 | $80,232 | $204,134 |
| 2024 | $3,912 | $278,791 | $78,659 | $200,132 |
| 2023 | $3,797 | $273,326 | $77,117 | $196,209 |
| 2022 | $3,731 | $267,966 | $75,604 | $192,362 |
| 2021 | $3,651 | $262,712 | $74,122 | $188,590 |
| 2020 | $3,592 | $260,018 | $73,362 | $186,656 |
| 2019 | $3,554 | $254,921 | $71,924 | $182,997 |
| 2018 | $3,484 | $249,923 | $70,514 | $179,409 |
| 2017 | $3,399 | $245,023 | $69,131 | $175,892 |
| 2016 | $3,332 | $240,219 | $67,776 | $172,443 |
| 2015 | $3,276 | $236,612 | $66,758 | $169,854 |
| 2014 | $3,221 | $231,978 | $65,451 | $166,527 |
Source: Public Records
Map
Nearby Homes
- 483 Becado Place
- 43547 Ellsworth St
- 646 Bella Vista Ct
- 379 Felipe Common
- 42099 Vinha Way
- 341 Dana St
- 43382 Bryant St
- 44423 View Point Cir
- 905 Glenhill Dr
- 43555 Puesta Del Sol
- 43150 Starr St
- 138 Telles Ln
- 42965 Corte Verde
- 42955 Corte Verde
- 335 Via Rosario
- 44989 Vista Del Sol
- 124 Linmore Dr
- 2164 Ocaso Camino
- 2450 Euclid Place
- 44520 Mesquite Ct
- 125 Gralina Terrace
- 129 Gralina Terrace
- 133 Gralina Terrace
- 43847 Olazaba Terrace
- 114 Lurene Dr
- 43851 Olazaba Terrace
- 110 Lurene Dr
- 118 Lurene Dr
- 43855 Olazaba Terrace
- 137 Gralina Terrace
- 122 Lurene Dr
- 43859 Olazaba Terrace
- 126 Lurene Dr
- 141 Gralina Terrace
- 43863 Olazaba Terrace
- 130 Lurene Dr
- 220 Lurene Dr
- 43801 Mission Blvd
- 43867 Olazaba Terrace
- 134 Lurene Dr