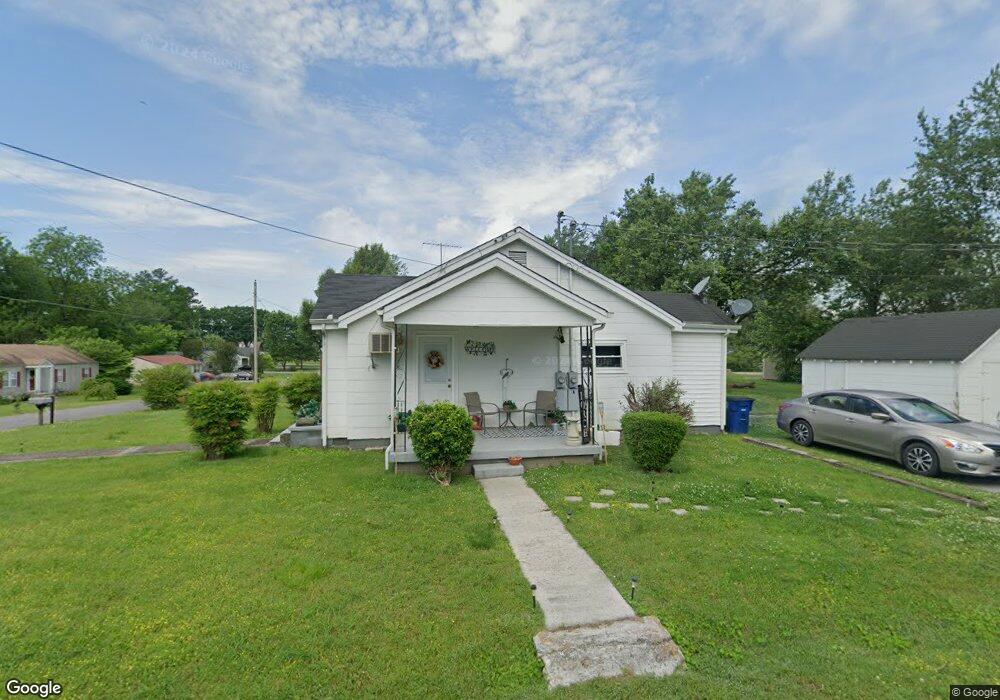
121 Hight St Shelbyville, TN 37160
Estimated Value: $225,607 - $329,000
--
Bed
2
Baths
1,651
Sq Ft
$166/Sq Ft
Est. Value
About This Home
This home is located at 121 Hight St, Shelbyville, TN 37160 and is currently estimated at $274,536, approximately $166 per square foot. 121 Hight St is a home located in Bedford County with nearby schools including South Side Elementary School, Harris Middle School, and Christian Chapel Academy.
Ownership History
Date
Name
Owned For
Owner Type
Purchase Details
Closed on
Jun 23, 2008
Sold by
Federal Home Loan Mortgage Corporation
Bought by
Farrar James
Current Estimated Value
Purchase Details
Closed on
Apr 29, 2008
Sold by
Darting Deborah
Bought by
Federal Home Loan Mortgage Corporation
Purchase Details
Closed on
Dec 23, 2002
Sold by
Spurlock Lanny D
Bought by
Darting Deborah L
Home Financials for this Owner
Home Financials are based on the most recent Mortgage that was taken out on this home.
Original Mortgage
$75,050
Interest Rate
5.99%
Purchase Details
Closed on
Apr 23, 2001
Bought by
Spurlock Lanny D
Purchase Details
Closed on
Jun 17, 1948
Bought by
Elam Robert J and Elam Margaret
Create a Home Valuation Report for This Property
The Home Valuation Report is an in-depth analysis detailing your home's value as well as a comparison with similar homes in the area
Home Values in the Area
Average Home Value in this Area
Purchase History
| Date | Buyer | Sale Price | Title Company |
|---|---|---|---|
| Farrar James | $52,500 | -- | |
| Federal Home Loan Mortgage Corporation | $76,076 | -- | |
| Darting Deborah L | $79,000 | -- | |
| Spurlock Lanny D | $74,000 | -- | |
| Elam Robert J | -- | -- |
Source: Public Records
Mortgage History
| Date | Status | Borrower | Loan Amount |
|---|---|---|---|
| Previous Owner | Elam Robert J | $75,050 |
Source: Public Records
Tax History Compared to Growth
Tax History
| Year | Tax Paid | Tax Assessment Tax Assessment Total Assessment is a certain percentage of the fair market value that is determined by local assessors to be the total taxable value of land and additions on the property. | Land | Improvement |
|---|---|---|---|---|
| 2025 | -- | $59,600 | $0 | $0 |
| 2024 | -- | $59,600 | $10,000 | $49,600 |
| 2023 | $882 | $59,600 | $10,000 | $49,600 |
| 2022 | $2,334 | $59,600 | $10,000 | $49,600 |
| 2021 | $2,119 | $59,600 | $10,000 | $49,600 |
| 2020 | $1,749 | $59,600 | $10,000 | $49,600 |
| 2019 | $1,749 | $39,480 | $8,280 | $31,200 |
| 2018 | $1,710 | $39,480 | $8,280 | $31,200 |
| 2017 | $1,710 | $39,480 | $8,280 | $31,200 |
| 2016 | $1,694 | $39,480 | $8,280 | $31,200 |
| 2015 | $1,694 | $39,480 | $8,280 | $31,200 |
| 2014 | $1,518 | $38,722 | $0 | $0 |
Source: Public Records
Map
Nearby Homes