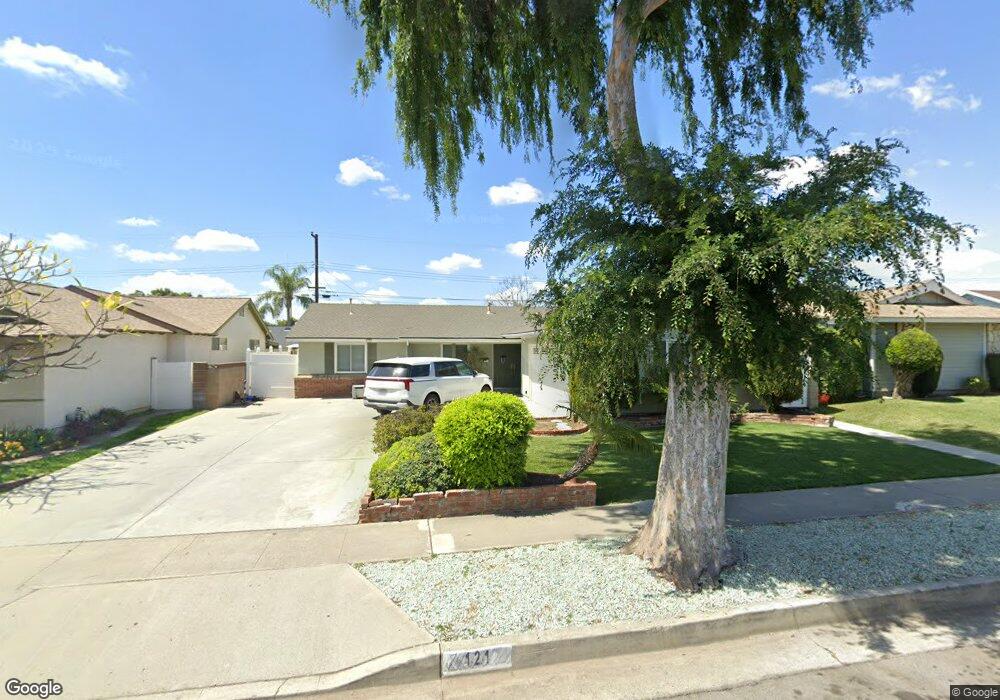
121 Holgate St La Habra, CA 90631
Estimated Value: $868,000 - $1,012,000
4
Beds
2
Baths
1,658
Sq Ft
$569/Sq Ft
Est. Value
About This Home
This home is located at 121 Holgate St, La Habra, CA 90631 and is currently estimated at $943,325, approximately $568 per square foot. 121 Holgate St is a home located in Orange County with nearby schools including Sierra Vista Elementary School, Ladera Palma Elementary School, and Washington Middle School.
Ownership History
Date
Name
Owned For
Owner Type
Purchase Details
Closed on
Jan 27, 2021
Sold by
Wong Brandon H and The Wong Living Trust
Bought by
Wong Brandon H and Wong Kyle J
Current Estimated Value
Purchase Details
Closed on
Feb 21, 2020
Sold by
Wong Henry
Bought by
Wong Henry and Wong Living Trust
Home Financials for this Owner
Home Financials are based on the most recent Mortgage that was taken out on this home.
Original Mortgage
$110,000
Outstanding Balance
$75,224
Interest Rate
3.6%
Mortgage Type
New Conventional
Estimated Equity
$868,101
Purchase Details
Closed on
Mar 22, 2006
Sold by
Thompson Janet M
Bought by
Wong Henry and Wong Laura M
Home Financials for this Owner
Home Financials are based on the most recent Mortgage that was taken out on this home.
Original Mortgage
$170,000
Interest Rate
6.29%
Mortgage Type
Fannie Mae Freddie Mac
Create a Home Valuation Report for This Property
The Home Valuation Report is an in-depth analysis detailing your home's value as well as a comparison with similar homes in the area
Home Values in the Area
Average Home Value in this Area
Purchase History
| Date | Buyer | Sale Price | Title Company |
|---|---|---|---|
| Wong Brandon H | -- | None Available | |
| Wong Henry | -- | Accommodation | |
| Wong Henry | -- | Wfg National Title Company | |
| Wong Henry | $542,500 | Lawyers Title Company |
Source: Public Records
Mortgage History
| Date | Status | Borrower | Loan Amount |
|---|---|---|---|
| Open | Wong Henry | $110,000 | |
| Closed | Wong Henry | $170,000 |
Source: Public Records
Tax History
| Year | Tax Paid | Tax Assessment Tax Assessment Total Assessment is a certain percentage of the fair market value that is determined by local assessors to be the total taxable value of land and additions on the property. | Land | Improvement |
|---|---|---|---|---|
| 2025 | $8,288 | $741,364 | $605,996 | $135,368 |
| 2024 | $8,288 | $726,828 | $594,114 | $132,714 |
| 2023 | $8,101 | $712,577 | $582,465 | $130,112 |
| 2022 | $8,022 | $698,605 | $571,044 | $127,561 |
| 2021 | $7,891 | $684,907 | $559,847 | $125,060 |
| 2020 | $7,740 | $677,885 | $554,107 | $123,778 |
| 2019 | $7,535 | $664,594 | $543,243 | $121,351 |
| 2018 | $7,467 | $651,563 | $532,591 | $118,972 |
| 2017 | $5,980 | $515,000 | $413,957 | $101,043 |
| 2016 | $5,948 | $515,000 | $413,957 | $101,043 |
| 2015 | $5,859 | $515,000 | $413,957 | $101,043 |
| 2014 | $4,683 | $410,400 | $309,357 | $101,043 |
Source: Public Records
Map
Nearby Homes
- 1414 W Central Ave Unit 81
- 1414 W Central Ave Unit 10
- 1414 W Central Ave Unit 19
- 1011 Delay St
- 1381 Harbor Lake Ave Unit 32
- 900 De Jur St
- 2210 Lake View Dr Unit 139
- 751 Village Lake Mall
- 1362 Fern Lake Ave Unit 113
- 2121 Lake Side Dr Unit 158
- 2251 Lake Glen Dr
- 2201 Lake View Dr
- 736 Knoll Lake Dr Unit 266
- 675 Wood Lake Dr Unit 186
- 2261 Lake Crest Ln Unit 83
- 1163 Delay St
- 655 Wood Lake Dr Unit 190
- 1020 Joyce Dr
- 304 S Colfax St
- 521 Forest Lake Dr Unit 64
Your Personal Tour Guide
Ask me questions while you tour the home.