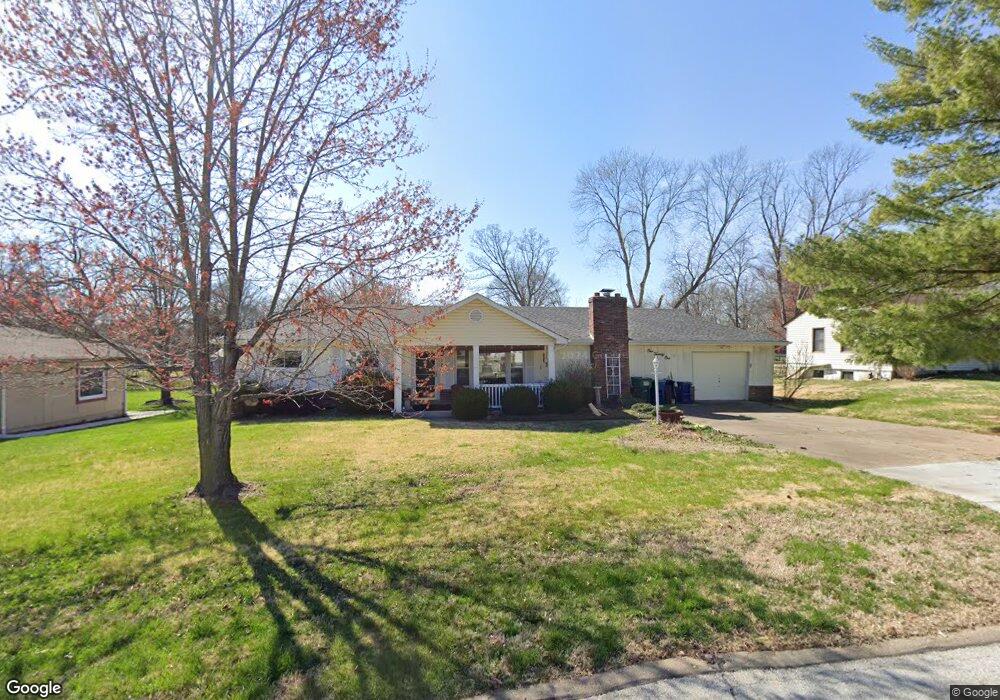
121 Ivy Ct Ballwin, MO 63011
Estimated Value: $282,443 - $310,000
3
Beds
2
Baths
1,416
Sq Ft
$208/Sq Ft
Est. Value
About This Home
This home is located at 121 Ivy Ct, Ballwin, MO 63011 and is currently estimated at $295,111, approximately $208 per square foot. 121 Ivy Ct is a home located in St. Louis County with nearby schools including Westridge Elementary School, Crestview Middle School, and Marquette Sr. High School.
Ownership History
Date
Name
Owned For
Owner Type
Purchase Details
Closed on
Apr 27, 2010
Sold by
Duchnowski Mary C and Poertner Linda C
Bought by
Cox Jane C
Current Estimated Value
Create a Home Valuation Report for This Property
The Home Valuation Report is an in-depth analysis detailing your home's value as well as a comparison with similar homes in the area
Home Values in the Area
Average Home Value in this Area
Purchase History
| Date | Buyer | Sale Price | Title Company |
|---|---|---|---|
| Cox Jane C | $160,000 | U S Title |
Source: Public Records
Tax History
| Year | Tax Paid | Tax Assessment Tax Assessment Total Assessment is a certain percentage of the fair market value that is determined by local assessors to be the total taxable value of land and additions on the property. | Land | Improvement |
|---|---|---|---|---|
| 2025 | $3,285 | $52,220 | $29,930 | $22,290 |
| 2024 | $3,285 | $46,840 | $21,380 | $25,460 |
| 2023 | $3,282 | $46,840 | $21,380 | $25,460 |
| 2022 | $3,251 | $43,090 | $23,520 | $19,570 |
| 2021 | $3,228 | $43,090 | $23,520 | $19,570 |
| 2020 | $2,748 | $34,920 | $17,860 | $17,060 |
| 2019 | $2,758 | $34,920 | $17,860 | $17,060 |
| 2018 | $2,587 | $30,860 | $14,060 | $16,800 |
| 2017 | $2,526 | $30,860 | $14,060 | $16,800 |
| 2016 | $2,187 | $25,650 | $9,960 | $15,690 |
Source: Public Records
Map
Nearby Homes
- 131 Romine Cir
- 101 Half Moon Bay Ln
- 815 Wendevy Ct Unit 16B
- 128 Shadalane Walk Unit A
- 837 Wendevy Ct Unit 11A
- 832 Wendevy Ct Unit 8B
- 839 Lilybud Ct Unit 5A
- 842 Wendevy Ct
- 845 Wendevy Ct Unit 12B
- 816 Crestland Dr
- 160 Cumberland Park Ct Unit G
- 614 Barton Ln
- 112 Shirley Ln
- 634 Parker Dr
- 107 Falmouth Dr
- 913 Crestland Dr
- 330 Sudbury Ln
- 557 Happy Ct
- 288 Geremma Dr
- 351 Greenbriar Ln
Your Personal Tour Guide
Ask me questions while you tour the home.