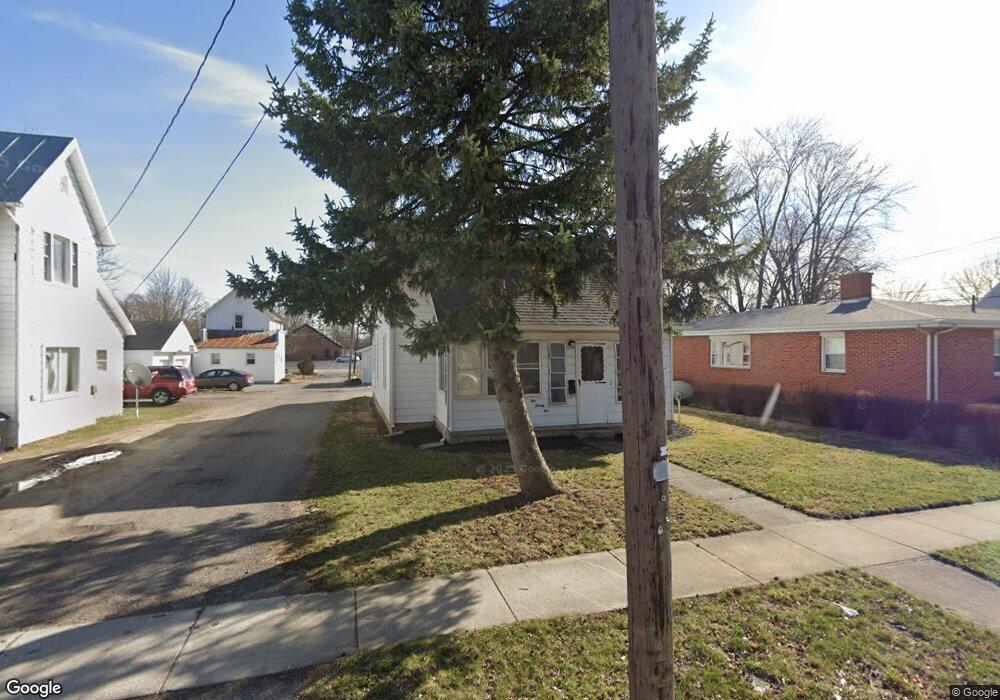
121 Larkins St Findlay, OH 45840
Estimated Value: $123,000 - $136,000
3
Beds
2
Baths
1,024
Sq Ft
$127/Sq Ft
Est. Value
About This Home
This home is located at 121 Larkins St, Findlay, OH 45840 and is currently estimated at $129,818, approximately $126 per square foot. 121 Larkins St is a home located in Hancock County with nearby schools including Whittier Primary School, Bigelow Hill Elementary School, and Glenwood Middle School.
Ownership History
Date
Name
Owned For
Owner Type
Purchase Details
Closed on
Apr 4, 2013
Sold by
Fields Thoma L and Fields Kathy R
Bought by
Welte Bart D
Current Estimated Value
Purchase Details
Closed on
Jun 4, 2001
Sold by
Fox James A
Bought by
Fields Thomas L and Fields Kathy R
Home Financials for this Owner
Home Financials are based on the most recent Mortgage that was taken out on this home.
Original Mortgage
$68,918
Interest Rate
7.23%
Mortgage Type
FHA
Purchase Details
Closed on
Jun 18, 1997
Sold by
Conley Anna
Bought by
Fox James and Fox Debbie
Home Financials for this Owner
Home Financials are based on the most recent Mortgage that was taken out on this home.
Original Mortgage
$35,750
Interest Rate
8.01%
Mortgage Type
New Conventional
Purchase Details
Closed on
Jun 1, 1990
Bought by
Conley Anna R
Create a Home Valuation Report for This Property
The Home Valuation Report is an in-depth analysis detailing your home's value as well as a comparison with similar homes in the area
Home Values in the Area
Average Home Value in this Area
Purchase History
We collect this data history from publicly available records. To have your information removed, we recommend requesting removal directly through your county’s website.
| Date | Buyer | Sale Price | Title Company |
|---|---|---|---|
| Welte Bart D | $60,000 | Assured Title Agency | |
| Fields Thomas L | $70,000 | -- | |
| Fox James | $55,000 | -- | |
| Conley Anna R | -- | -- |
Source: Public Records
Mortgage History
We collect this data history from publicly available records. To have your information removed, we recommend requesting removal directly through your county’s website.
| Date | Status | Borrower | Loan Amount |
|---|---|---|---|
| Previous Owner | Fields Thomas L | $68,918 | |
| Previous Owner | Fox James | $35,750 |
Source: Public Records
Tax History
| Year | Tax Paid | Tax Assessment Tax Assessment Total Assessment is a certain percentage of the fair market value that is determined by local assessors to be the total taxable value of land and additions on the property. | Land | Improvement |
|---|---|---|---|---|
| 2024 | $1,154 | $31,670 | $4,080 | $27,590 |
| 2023 | $1,156 | $31,670 | $4,080 | $27,590 |
| 2022 | $1,152 | $31,670 | $4,080 | $27,590 |
| 2021 | $1,020 | $24,410 | $4,100 | $20,310 |
| 2020 | $1,019 | $24,410 | $4,100 | $20,310 |
| 2019 | $999 | $24,410 | $4,100 | $20,310 |
| 2018 | $952 | $21,340 | $3,560 | $17,780 |
| 2017 | $953 | $21,340 | $3,560 | $17,780 |
| 2016 | $951 | $21,340 | $3,560 | $17,780 |
| 2015 | $741 | $16,480 | $3,560 | $12,920 |
| 2014 | $741 | $16,480 | $3,560 | $12,920 |
| 2012 | $812 | $18,410 | $3,560 | $14,850 |
Source: Public Records
Map
Nearby Homes
- 117 Larkins St
- 127 Larkins St
- 126 Prospect Ave
- 120 Prospect Ave
- 115 Larkins St
- 135 Larkins St
- 130 Prospect Ave
- 132 Prospect Ave
- 112 Prospect Ave
- 139 Larkins St
- 200 Prospect Ave
- 122 Larkins St
- 118 Larkins St
- 126 Larkins St
- 140 Larkins St
- 143 Larkins St
- 130 Larkins St
- 204 Prospect Ave
- 136 Larkins St
- 815 N Main St
Your Personal Tour Guide
Ask me questions while you tour the home.