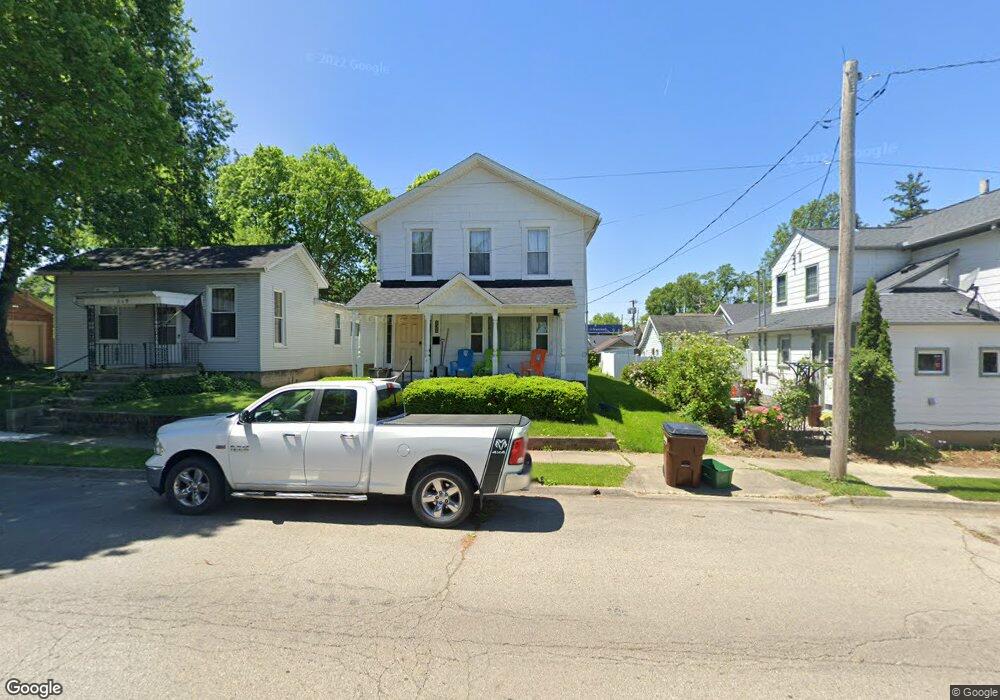
121 N 4th St Tipp City, OH 45371
Estimated Value: $127,000 - $193,000
4
Beds
1
Bath
1,610
Sq Ft
$105/Sq Ft
Est. Value
About This Home
This home is located at 121 N 4th St, Tipp City, OH 45371 and is currently estimated at $169,564, approximately $105 per square foot. 121 N 4th St is a home located in Miami County with nearby schools including Broadway Elementary School, Nevin Coppock Elementary School, and L. T. Ball Intermediate School.
Ownership History
Date
Name
Owned For
Owner Type
Purchase Details
Closed on
Sep 7, 2021
Sold by
Eyler Raymond E
Bought by
Reed Daniel R
Current Estimated Value
Home Financials for this Owner
Home Financials are based on the most recent Mortgage that was taken out on this home.
Original Mortgage
$95,000
Outstanding Balance
$72,514
Interest Rate
2.1%
Mortgage Type
New Conventional
Estimated Equity
$97,050
Purchase Details
Closed on
Apr 1, 2021
Sold by
Eyler Raymond E and Eyler Family Revocable Living
Bought by
Eyler Raymond E and Lachey Charles R
Purchase Details
Closed on
Sep 7, 2001
Sold by
Lackey Virginia Lee and Eyler Virginia L
Bought by
Eyler Raymond E and Eyler Virginia L
Purchase Details
Closed on
Dec 1, 1979
Bought by
Lachey Virginia Lee
Create a Home Valuation Report for This Property
The Home Valuation Report is an in-depth analysis detailing your home's value as well as a comparison with similar homes in the area
Home Values in the Area
Average Home Value in this Area
Purchase History
| Date | Buyer | Sale Price | Title Company |
|---|---|---|---|
| Reed Daniel R | $127,500 | None Available | |
| Reed Danicl R | -- | None Listed On Document | |
| Eyler Raymond E | -- | None Available | |
| Eyler Raymond E | -- | -- | |
| Lachey Virginia Lee | -- | -- |
Source: Public Records
Mortgage History
| Date | Status | Borrower | Loan Amount |
|---|---|---|---|
| Open | Reed Danicl R | $95,000 | |
| Closed | Reed Daniel R | $95,000 |
Source: Public Records
Tax History Compared to Growth
Tax History
| Year | Tax Paid | Tax Assessment Tax Assessment Total Assessment is a certain percentage of the fair market value that is determined by local assessors to be the total taxable value of land and additions on the property. | Land | Improvement |
|---|---|---|---|---|
| 2024 | $1,645 | $33,040 | $7,840 | $25,200 |
| 2023 | $1,645 | $33,040 | $7,840 | $25,200 |
| 2022 | $1,499 | $33,040 | $7,840 | $25,200 |
| 2021 | $1,302 | $25,380 | $5,990 | $19,390 |
| 2020 | $1,317 | $25,380 | $5,990 | $19,390 |
| 2019 | $1,328 | $25,380 | $5,990 | $19,390 |
| 2018 | $1,217 | $21,710 | $6,480 | $15,230 |
| 2017 | $1,222 | $21,710 | $6,480 | $15,230 |
| 2016 | $1,183 | $21,710 | $6,480 | $15,230 |
| 2015 | $1,036 | $20,100 | $5,990 | $14,110 |
| 2014 | $1,036 | $20,100 | $5,990 | $14,110 |
| 2013 | $1,041 | $20,100 | $5,990 | $14,110 |
Source: Public Records
Map
Nearby Homes