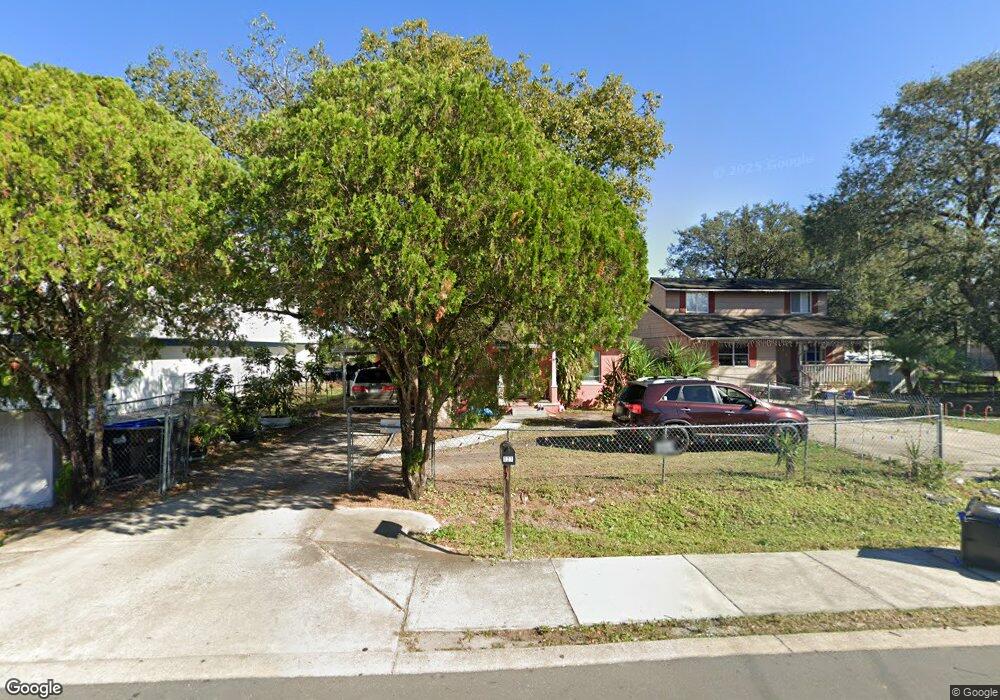
121 N Hastings St Orlando, FL 32835
MetroWest NeighborhoodEstimated Value: $196,000 - $208,000
2
Beds
1
Bath
960
Sq Ft
$210/Sq Ft
Est. Value
About This Home
This home is located at 121 N Hastings St, Orlando, FL 32835 and is currently estimated at $201,519, approximately $209 per square foot. 121 N Hastings St is a home located in Orange County with nearby schools including Orlo Vista Elementary, Chain of Lakes Middle School, and Olympia High.
Ownership History
Date
Name
Owned For
Owner Type
Purchase Details
Closed on
Dec 29, 2022
Sold by
Chen Vanna Tea
Bought by
6027 R Llc
Current Estimated Value
Purchase Details
Closed on
Aug 10, 2022
Sold by
Johnnysidararoth Chen
Bought by
Chen Vanna Tea
Purchase Details
Closed on
Oct 30, 2003
Sold by
Bic Trading Inc
Bought by
Chen Johny Sidararoth and Chen Vanna Tea
Home Financials for this Owner
Home Financials are based on the most recent Mortgage that was taken out on this home.
Original Mortgage
$59,200
Interest Rate
6%
Mortgage Type
Purchase Money Mortgage
Purchase Details
Closed on
Jan 7, 2000
Sold by
Mcgee Jason R
Bought by
Bic Trading Inc
Home Financials for this Owner
Home Financials are based on the most recent Mortgage that was taken out on this home.
Original Mortgage
$37,500
Interest Rate
7.8%
Mortgage Type
New Conventional
Purchase Details
Closed on
Jun 6, 1996
Sold by
Clerk Of The Court
Bought by
Halstead David and Halstead Renee A
Create a Home Valuation Report for This Property
The Home Valuation Report is an in-depth analysis detailing your home's value as well as a comparison with similar homes in the area
Home Values in the Area
Average Home Value in this Area
Purchase History
| Date | Buyer | Sale Price | Title Company |
|---|---|---|---|
| 6027 R Llc | $100 | -- | |
| Chen Vanna Tea | $100 | None Listed On Document | |
| Chen Johny Sidararoth | $74,000 | Ovt Title Agency Llc | |
| Bic Trading Inc | $50,000 | -- | |
| Halstead David | $100 | -- |
Source: Public Records
Mortgage History
| Date | Status | Borrower | Loan Amount |
|---|---|---|---|
| Previous Owner | Chen Johny Sidararoth | $59,200 | |
| Previous Owner | Halstead David | $37,500 |
Source: Public Records
Tax History Compared to Growth
Tax History
| Year | Tax Paid | Tax Assessment Tax Assessment Total Assessment is a certain percentage of the fair market value that is determined by local assessors to be the total taxable value of land and additions on the property. | Land | Improvement |
|---|---|---|---|---|
| 2025 | $1,871 | $83,463 | -- | -- |
| 2024 | $1,721 | $75,875 | -- | -- |
| 2023 | $1,721 | $125,151 | $45,500 | $79,651 |
| 2022 | $1,473 | $100,109 | $31,000 | $69,109 |
| 2021 | $1,143 | $55,258 | $25,900 | $29,358 |
| 2020 | $1,058 | $55,258 | $25,900 | $29,358 |
| 2019 | $1,062 | $55,258 | $25,900 | $29,358 |
| 2018 | $1,029 | $54,036 | $18,000 | $36,036 |
| 2017 | $885 | $40,158 | $10,000 | $30,158 |
| 2016 | $781 | $32,177 | $8,000 | $24,177 |
| 2015 | $803 | $32,324 | $8,000 | $24,324 |
| 2014 | $863 | $32,831 | $8,000 | $24,831 |
Source: Public Records
Map
Nearby Homes
- 244 N Hastings St
- 233 N Hudson St
- 5525 W Central Blvd
- 5435 Roman Ln Unit 50
- 25 S Mckinley Ave
- 241 Ronnie Cir
- 313 Ronnie Cir
- 308 Hope Cir
- 5910 Old Winter Garden Rd
- 223 Hope Cir
- 309 Hope Cir
- 6227 Melbourne Ave
- 217 Wilmer Ave
- 402 S Hudson St
- 410 S Hudson St
- 310 Parrish Ave
- 310 N Pine Hills Rd
- 387 N Pine Hills Rd
- 379 N Pine Hills Rd
- 363 N Pine Hills Rd
- 111 N Hastings St
- 109 N Hastings St
- 120 N Hastings St
- 122 N Hastings St
- 128 N Hastings St
- 5712 W Washington St
- 210 N Kirkman Rd
- 104 N Hastings St
- 5803 W Washington St
- 48 N Kirkman Rd
- 5813 W Washington St
- 5809 W Washington St
- 5810 W Washington St
- 119 N Normandale Ave
- 123 N Normandale Ave
- 127 N Normandale Ave
- 117 N Kirkman Rd
- 38 N Hastings St
- 121 N Kirkman Rd
- 129 N Kirkman Rd