Estimated Value: $364,000 - $423,458
3
Beds
2
Baths
2,280
Sq Ft
$177/Sq Ft
Est. Value
About This Home
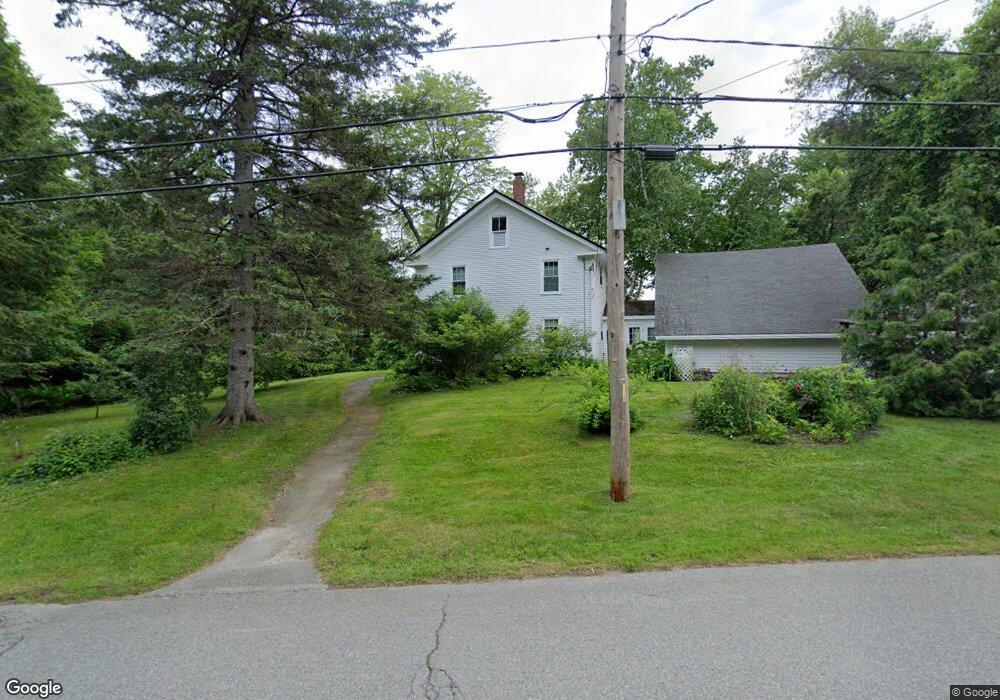
This home is located at 121 N Main Ave, Orono, ME 04473 and is currently estimated at $402,615, approximately $176 per square foot. 121 N Main Ave is a home located in Penobscot County with nearby schools including Orono Middle School and Orono High School.
Ownership History
Date
Name
Owned For
Owner Type
Purchase Details
Closed on
Mar 3, 2009
Sold by
Alford Jo Carol
Bought by
Kelley Joseph T and Kelley Alice R
Current Estimated Value
Purchase Details
Closed on
Sep 14, 2006
Sold by
Ferketic John A and Ferketic Kimberly K
Bought by
Alford A R and Alford Jo C
Home Financials for this Owner
Home Financials are based on the most recent Mortgage that was taken out on this home.
Original Mortgage
$187,000
Interest Rate
6.71%
Mortgage Type
Commercial
Create a Home Valuation Report for This Property
The Home Valuation Report is an in-depth analysis detailing your home's value as well as a comparison with similar homes in the area
Home Values in the Area
Average Home Value in this Area
Purchase History
| Date | Buyer | Sale Price | Title Company |
|---|---|---|---|
| Kelley Joseph T | -- | -- | |
| Alford A R | -- | -- |
Source: Public Records
Mortgage History
| Date | Status | Borrower | Loan Amount |
|---|---|---|---|
| Previous Owner | Kelley Joseph T | $25,000 | |
| Previous Owner | Alford A R | $187,000 |
Source: Public Records
Tax History
| Year | Tax Paid | Tax Assessment Tax Assessment Total Assessment is a certain percentage of the fair market value that is determined by local assessors to be the total taxable value of land and additions on the property. | Land | Improvement |
|---|---|---|---|---|
| 2024 | $6,422 | $300,800 | $50,500 | $250,300 |
| 2023 | $6,398 | $273,400 | $45,900 | $227,500 |
| 2022 | $6,507 | $273,400 | $45,900 | $227,500 |
| 2021 | $6,493 | $273,400 | $45,900 | $227,500 |
| 2020 | $7,461 | $265,600 | $87,000 | $178,600 |
| 2019 | $7,025 | $265,600 | $87,000 | $178,600 |
| 2018 | $7,171 | $265,600 | $87,000 | $178,600 |
| 2017 | $6,906 | $265,600 | $87,000 | $178,600 |
| 2016 | $6,600 | $265,600 | $87,000 | $178,600 |
| 2015 | $6,481 | $265,600 | $87,000 | $178,600 |
| 2014 | $6,566 | $275,300 | $96,700 | $178,600 |
| 2013 | $6,387 | $275,300 | $96,700 | $178,600 |
Source: Public Records
Map
Nearby Homes
- 5 Shore Dr Unit 10
- 5 Summer St
- 10 Spruce St
- 50 College Ave
- 7 Forest Ave
- 148 College Ave
- 71 Penney Ln
- 12 Island Ave
- 4 Gilbert St
- 6 Gilbert St
- 103 Margin St
- Lot 1 & 15 Union St
- 78 High Point Place
- 8 Sylvan Rd
- 1024 Stillwater Ave
- 715 College Ave Unit 24
- 915 Stillwater Ave
- Lot 14 Grant Rd
- Map17Lot53 Grant Rd
- Lot 12 Grant Rd