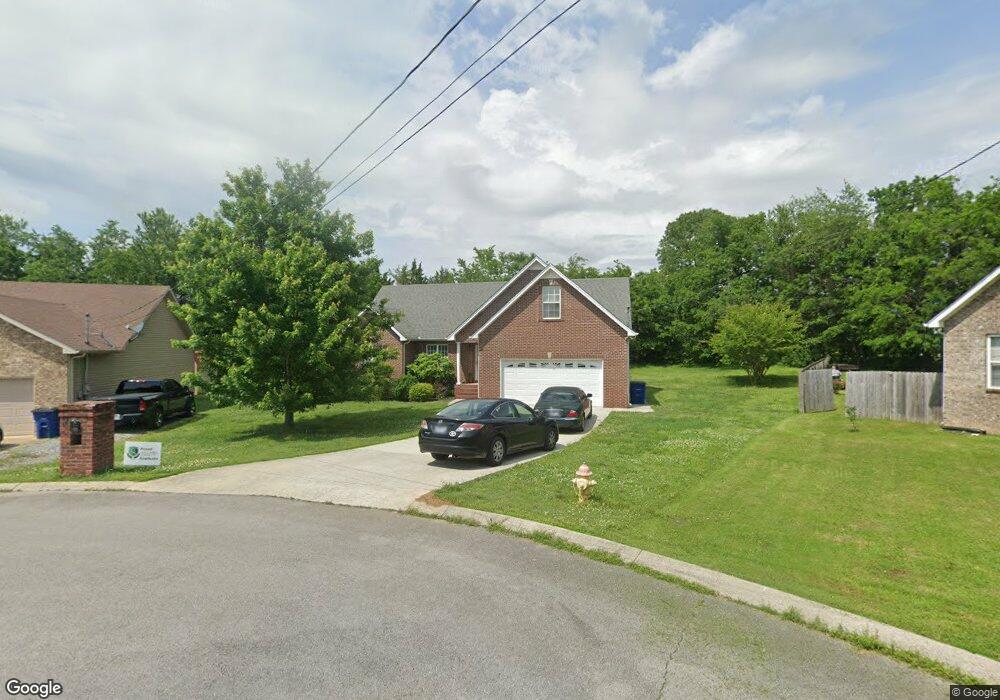
121 Raven Ln Shelbyville, TN 37160
Estimated Value: $332,213 - $361,000
--
Bed
3
Baths
1,685
Sq Ft
$205/Sq Ft
Est. Value
About This Home
This home is located at 121 Raven Ln, Shelbyville, TN 37160 and is currently estimated at $345,553, approximately $205 per square foot. 121 Raven Ln is a home located in Bedford County with nearby schools including Eakin Elementary School, Harris Middle School, and Victory Baptist Academy.
Ownership History
Date
Name
Owned For
Owner Type
Purchase Details
Closed on
Jun 15, 2018
Sold by
Strickland Kevin and Strickland Miranda
Bought by
Cmg Mortgage Inc
Current Estimated Value
Home Financials for this Owner
Home Financials are based on the most recent Mortgage that was taken out on this home.
Original Mortgage
$191,468
Outstanding Balance
$166,605
Interest Rate
4.87%
Mortgage Type
FHA
Estimated Equity
$178,948
Purchase Details
Closed on
Aug 30, 2013
Sold by
Naron Jennifer D
Bought by
Rader Dathan and Rader Leah K
Home Financials for this Owner
Home Financials are based on the most recent Mortgage that was taken out on this home.
Original Mortgage
$121,125
Interest Rate
4.37%
Mortgage Type
Commercial
Purchase Details
Closed on
Jul 13, 2007
Sold by
Glover G G
Bought by
Naron Jennifer D
Create a Home Valuation Report for This Property
The Home Valuation Report is an in-depth analysis detailing your home's value as well as a comparison with similar homes in the area
Home Values in the Area
Average Home Value in this Area
Purchase History
| Date | Buyer | Sale Price | Title Company |
|---|---|---|---|
| Cmg Mortgage Inc | $195,000 | Foundation Title & Escrow | |
| Rader Dathan | $142,500 | -- | |
| Naron Jennifer D | $137,000 | -- |
Source: Public Records
Mortgage History
| Date | Status | Borrower | Loan Amount |
|---|---|---|---|
| Open | Cmg Mortgage Inc | $191,468 | |
| Previous Owner | Rader Dathan | $121,125 |
Source: Public Records
Tax History Compared to Growth
Tax History
| Year | Tax Paid | Tax Assessment Tax Assessment Total Assessment is a certain percentage of the fair market value that is determined by local assessors to be the total taxable value of land and additions on the property. | Land | Improvement |
|---|---|---|---|---|
| 2025 | -- | $53,050 | $0 | $0 |
| 2024 | -- | $53,050 | $7,500 | $45,550 |
| 2023 | $2,019 | $53,050 | $7,500 | $45,550 |
| 2022 | $2,078 | $53,050 | $7,500 | $45,550 |
| 2021 | $1,887 | $53,050 | $7,500 | $45,550 |
| 2020 | $1,580 | $53,050 | $7,500 | $45,550 |
| 2019 | $1,580 | $35,675 | $5,000 | $30,675 |
| 2018 | $1,544 | $35,675 | $5,000 | $30,675 |
| 2017 | $1,544 | $35,675 | $5,000 | $30,675 |
| 2016 | $1,530 | $35,675 | $5,000 | $30,675 |
| 2015 | $1,530 | $35,675 | $5,000 | $30,675 |
| 2014 | $1,354 | $34,540 | $0 | $0 |
Source: Public Records
Map
Nearby Homes
- 117 Raven Ct
- 0 Richdale Ln
- 104 Indy Ct
- 104 Hillview Ave
- 201 Hillview Ave
- 222 Hillview Ave
- 409 Winners Cir
- 321 Winners Cir
- 103 Meadowbrook
- 105 Winners Cir
- 149 Brown Ln
- 102 Hidden
- 294 McDale Rd
- 112 Hidden
- 114 Hidden
- 116 Hidden
- 118 Hidden
- Prelude Plan at Idle Reserve
- Wayfare Plan at Idle Reserve
- Venture Plan at Idle Reserve