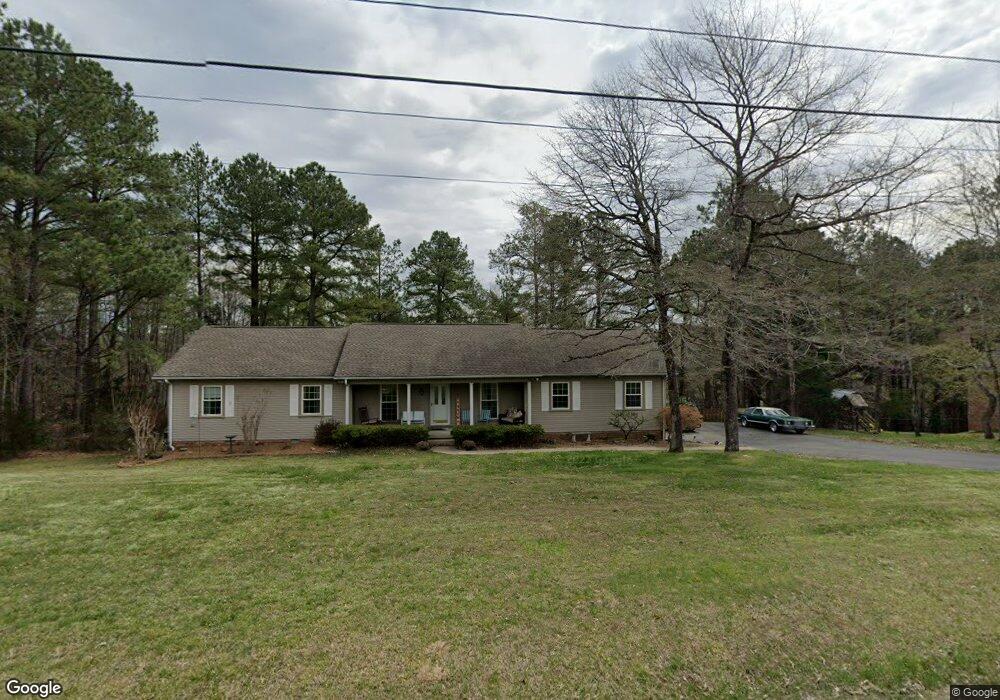
121 Redbud Dr Dickson, TN 37055
Estimated Value: $344,414 - $374,000
Studio
2
Baths
1,456
Sq Ft
$248/Sq Ft
Est. Value
About This Home
This home is located at 121 Redbud Dr, Dickson, TN 37055 and is currently estimated at $361,104, approximately $248 per square foot. 121 Redbud Dr is a home located in Dickson County with nearby schools including Oakmont Elementary School, Burns Middle School, and Dickson County High School.
Ownership History
Date
Name
Owned For
Owner Type
Purchase Details
Closed on
May 6, 2022
Sold by
Sue Graham Genevia and Downing Robert
Bought by
Schroeder Jeffrey Donald and Schroeder Lurena Marche
Current Estimated Value
Home Financials for this Owner
Home Financials are based on the most recent Mortgage that was taken out on this home.
Original Mortgage
$314,204
Outstanding Balance
$294,191
Interest Rate
4.42%
Mortgage Type
FHA
Estimated Equity
$66,913
Purchase Details
Closed on
Jan 22, 2021
Sold by
Burkhart Ricky Lane and Dorothy Marie Burkhart Special
Bought by
Graham Genevia Sue and Graham Robert Downing
Home Financials for this Owner
Home Financials are based on the most recent Mortgage that was taken out on this home.
Original Mortgage
$225,000
Interest Rate
2.71%
Mortgage Type
New Conventional
Purchase Details
Closed on
Jan 25, 2016
Sold by
Clarkson Debra
Bought by
Burkhart Roy L
Purchase Details
Closed on
Sep 8, 2004
Bought by
Clarkson L W Egtux Debra
Purchase Details
Closed on
Jun 10, 1997
Sold by
Rachford Wayne L
Bought by
Barrero Andre and Barrero Toshiko
Home Financials for this Owner
Home Financials are based on the most recent Mortgage that was taken out on this home.
Original Mortgage
$89,000
Interest Rate
7.97%
Purchase Details
Closed on
Oct 19, 1990
Bought by
Ratchford Wayne L and Ratchford Sonia L
Purchase Details
Closed on
Oct 2, 1989
Bought by
Dickson County Board Of Education
Purchase Details
Closed on
Jun 14, 1985
Bought by
Duke Wm J and Duke Fred
Create a Home Valuation Report for This Property
The Home Valuation Report is an in-depth analysis detailing your home's value as well as a comparison with similar homes in the area
Home Values in the Area
Average Home Value in this Area
Purchase History
| Date | Buyer | Sale Price | Title Company |
|---|---|---|---|
| Schroeder Jeffrey Donald | $320,000 | Bankers Title & Escrow | |
| Graham Genevia Sue | $250,000 | Bankers T&E Dickson Llc | |
| Burkhart Roy L | $144,900 | -- | |
| Clarkson L W Egtux Debra | $127,400 | -- | |
| Barrero Andre | $109,000 | -- | |
| Ratchford Wayne L | $76,000 | -- | |
| Dickson County Board Of Education | $13,500 | -- | |
| Duke Wm J | -- | -- |
Source: Public Records
Mortgage History
| Date | Status | Borrower | Loan Amount |
|---|---|---|---|
| Open | Schroeder Jeffrey Donald | $314,204 | |
| Previous Owner | Graham Genevia Sue | $225,000 | |
| Previous Owner | Duke Wm J | $89,000 |
Source: Public Records
Tax History
| Year | Tax Paid | Tax Assessment Tax Assessment Total Assessment is a certain percentage of the fair market value that is determined by local assessors to be the total taxable value of land and additions on the property. | Land | Improvement |
|---|---|---|---|---|
| 2025 | -- | $79,875 | $15,000 | $64,875 |
| 2024 | -- | $79,875 | $15,000 | $64,875 |
| 2023 | $1,493 | $47,775 | $6,825 | $40,950 |
| 2022 | $1,493 | $47,775 | $6,825 | $40,950 |
| 2021 | $1,493 | $47,775 | $6,825 | $40,950 |
| 2020 | $1,493 | $47,775 | $6,825 | $40,950 |
| 2019 | $1,493 | $47,775 | $6,825 | $40,950 |
| 2018 | $1,352 | $37,050 | $5,750 | $31,300 |
| 2017 | $1,352 | $37,050 | $5,750 | $31,300 |
| 2016 | $1,352 | $37,050 | $5,750 | $31,300 |
| 2015 | $1,238 | $31,925 | $5,750 | $26,175 |
| 2014 | $1,238 | $31,925 | $5,750 | $26,175 |
Source: Public Records
Map
Nearby Homes
- 108 Eastwood Dr
- 123 Eastdale Ln
- 114 Eastdale Ln
- 207 Robinson Dr
- 103 Mack Dr
- 108 W Quail Hollow Way
- 617 Blue Rd
- 0 Blue Rd
- 312 Bluebird Ln
- 815 Highway 70 E
- 103 Forrest Hills Dr
- 145 Bishop Ln
- 101 Lake Circle Dr
- 307 Crestview Dr
- 422 Shady Hill Rd
- 2237 Highway 47 E
- 101 W Hills Terrace
- 1179 Tennessee 47
- 1021 Woodmont Dr
- 107 Florence Cove
Your Personal Tour Guide
Ask me questions while you tour the home.