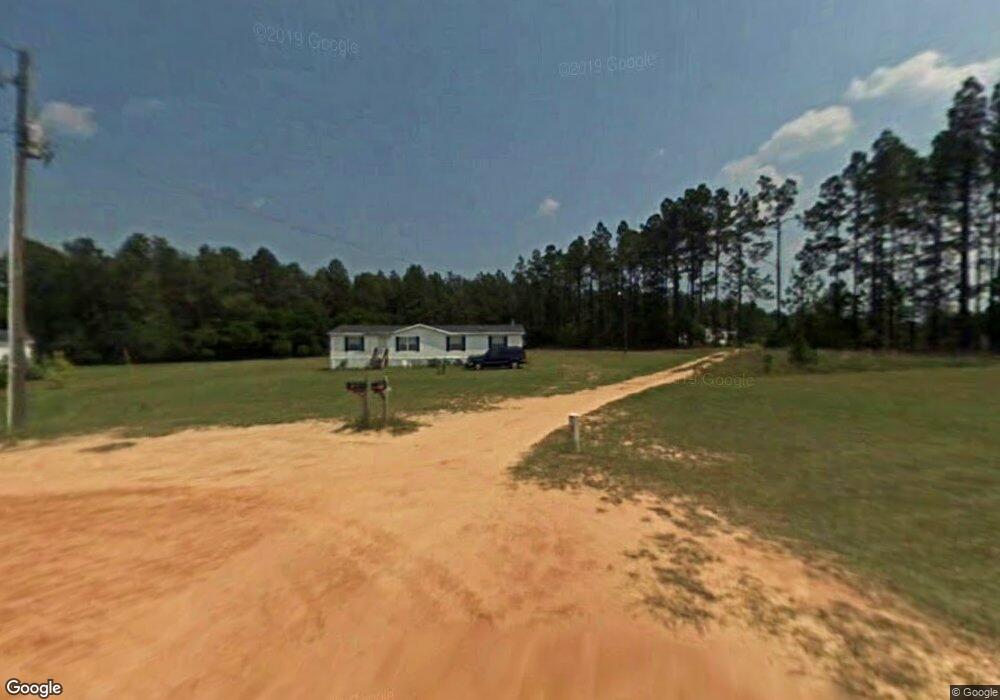
121 Ruby Mae Ln Gaston, SC 29053
Estimated Value: $107,000 - $173,343
3
Beds
2
Baths
1,759
Sq Ft
$83/Sq Ft
Est. Value
About This Home
This home is located at 121 Ruby Mae Ln, Gaston, SC 29053 and is currently estimated at $145,586, approximately $82 per square foot. 121 Ruby Mae Ln is a home located in Lexington County with nearby schools including Sandhills Primary School, Sandhills Elementary School, and Sandhills Middle School.
Ownership History
Date
Name
Owned For
Owner Type
Purchase Details
Closed on
Feb 16, 2017
Sold by
Secretary Of Housing And Urban Developme
Bought by
Leal Elpidio Ponce
Current Estimated Value
Purchase Details
Closed on
Mar 31, 2015
Sold by
Freedom Mortgage Corporation
Bought by
Secretary Housing Urban Development
Purchase Details
Closed on
Sep 28, 2009
Sold by
1600 Park Circle Suite 918 Llc
Bought by
Lloyd Sherrie
Home Financials for this Owner
Home Financials are based on the most recent Mortgage that was taken out on this home.
Original Mortgage
$90,491
Interest Rate
5.1%
Mortgage Type
FHA
Purchase Details
Closed on
Aug 4, 2008
Sold by
Federal Home Loan Mortgage Corporation
Bought by
1600 Park Circle Suite 918 Llc
Purchase Details
Closed on
Apr 22, 2008
Sold by
Evetts Melissa and Wells Fargo Bank Na
Bought by
Federal Home Loan Mortgage Corporation
Purchase Details
Closed on
May 6, 2004
Sold by
Lattimore Bldrs Inc
Bought by
Lavender Jim E
Create a Home Valuation Report for This Property
The Home Valuation Report is an in-depth analysis detailing your home's value as well as a comparison with similar homes in the area
Home Values in the Area
Average Home Value in this Area
Purchase History
| Date | Buyer | Sale Price | Title Company |
|---|---|---|---|
| Leal Elpidio Ponce | $275,000 | None Available | |
| Secretary Housing Urban Development | -- | None Available | |
| Lloyd Sherrie | $92,161 | -- | |
| 1600 Park Circle Suite 918 Llc | $31,000 | -- | |
| Federal Home Loan Mortgage Corporation | $15,000 | -- | |
| Lavender Jim E | $160,033 | -- |
Source: Public Records
Mortgage History
| Date | Status | Borrower | Loan Amount |
|---|---|---|---|
| Previous Owner | Lloyd Sherrie | $90,491 |
Source: Public Records
Tax History
| Year | Tax Paid | Tax Assessment Tax Assessment Total Assessment is a certain percentage of the fair market value that is determined by local assessors to be the total taxable value of land and additions on the property. | Land | Improvement |
|---|---|---|---|---|
| 2024 | $2,721 | $5,205 | $780 | $4,425 |
| 2023 | $2,388 | $5,205 | $780 | $4,425 |
| 2020 | $2,405 | $5,205 | $780 | $4,425 |
| 2019 | $2,567 | $5,530 | $720 | $4,810 |
| 2018 | $2,557 | $5,530 | $720 | $4,810 |
| 2017 | $2,518 | $5,530 | $720 | $4,810 |
| 2016 | $208 | $3,686 | $480 | $3,206 |
| 2015 | $234 | $3,686 | $480 | $3,206 |
| 2014 | $278 | $3,686 | $480 | $3,206 |
| 2013 | -- | $3,690 | $480 | $3,210 |
Source: Public Records
Map
Nearby Homes
- 315 Silver Spur Way
- 318 Silver Spur Way
- 410 Olive Grouse Ln
- 405 Olive Grouse Ln
- 418 Olive Grouse Ln
- 409 Olive Grouse Ln
- 302 Silver Spur Way
- 422 Olive Grouse Ln
- 423 Olive Grouse Ln
- 149 Hass Lucas Rd
- 320 Fallaw Rd
- 427 Olive Grouse Ln
- 2201 Sharpes Hill Rd
- 436 Forestbrook Ct
- 0 Meadowfield Rd Unit 585500
- 177 Glencrest Dr
- 0 Forestbrook Ln
- 145 Glencrest Dr
- Lot 2 Mimosa Dr
- Lot 9 Mimosa Dr
- 117 Ruby Mae Ln
- 112 Ruby Mae Ln
- 113 Ruby Mae Ln
- 108 Ruby Mae Ln
- 109 Ruby Mae Ln
- 119 Vonta Ln
- 105 Ruby Mae Ln
- 120 Vonta Ln
- 100 Ruby Mae Ln
- 1061 Long Spires Ct
- 264 Hass Lucas Rd
- 115 Vonta Ln
- 248 Hass Lucas Rd
- 1051 Long Spires Ct
- 112 Vonta Ln
- 111 Vonta Ln
- 1064 Long Spires Ct
- 105 Vonta Ln
- 1052 Long Spires Ct
- 108 Vonta Ln
Your Personal Tour Guide
Ask me questions while you tour the home.