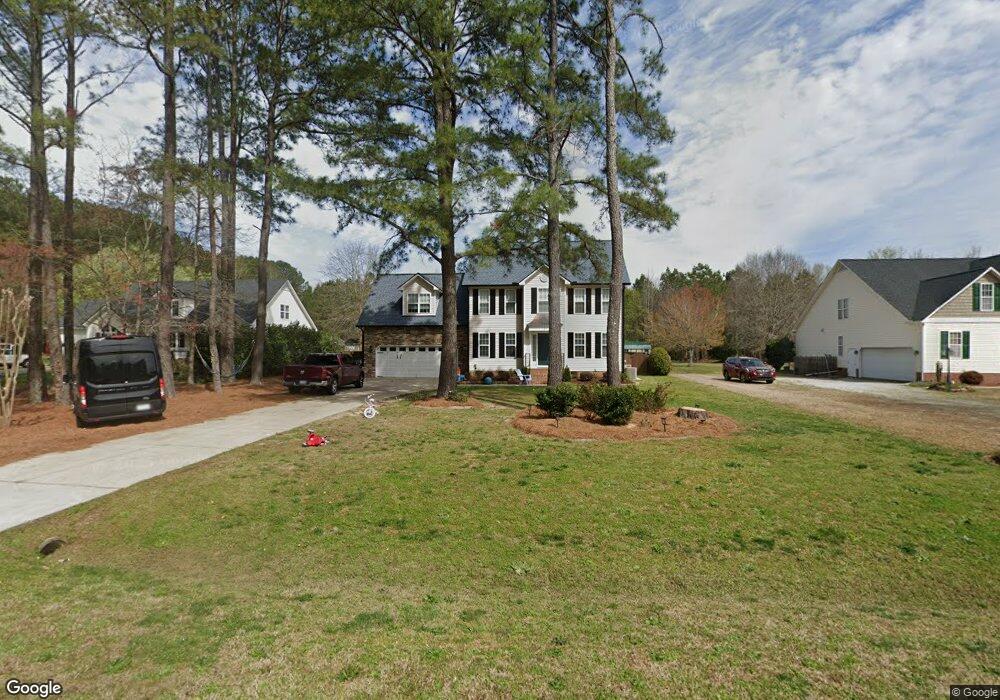
121 Rustic Ln Smithfield, NC 27577
Estimated Value: $369,419 - $384,000
3
Beds
3
Baths
2,376
Sq Ft
$159/Sq Ft
Est. Value
About This Home
This home is located at 121 Rustic Ln, Smithfield, NC 27577 and is currently estimated at $378,605, approximately $159 per square foot. 121 Rustic Ln is a home located in Johnston County with nearby schools including Polenta Elementary School, Swift Creek Middle, and Cleveland High School.
Ownership History
Date
Name
Owned For
Owner Type
Purchase Details
Closed on
Mar 26, 2019
Sold by
Montgomery Jeanne
Bought by
Saravia Nativi Carlos Enrique and Valdes Cesia Lizeth
Current Estimated Value
Home Financials for this Owner
Home Financials are based on the most recent Mortgage that was taken out on this home.
Original Mortgage
$184,000
Outstanding Balance
$165,167
Interest Rate
5.5%
Mortgage Type
Adjustable Rate Mortgage/ARM
Estimated Equity
$213,438
Purchase Details
Closed on
Mar 29, 2017
Sold by
Hamrick Bruce W and Hamrick Summer Lea
Bought by
Montgomery Jeanne
Home Financials for this Owner
Home Financials are based on the most recent Mortgage that was taken out on this home.
Original Mortgage
$221,460
Interest Rate
4.15%
Mortgage Type
New Conventional
Purchase Details
Closed on
Oct 18, 2004
Sold by
Hamrick Bruce W
Bought by
Scott Lee Homes Inc A Nc Corp
Purchase Details
Closed on
Jan 15, 2004
Sold by
Scott Lee Homes Inc A Nc Corp
Bought by
Lee Brothers Rental
Create a Home Valuation Report for This Property
The Home Valuation Report is an in-depth analysis detailing your home's value as well as a comparison with similar homes in the area
Home Values in the Area
Average Home Value in this Area
Purchase History
| Date | Buyer | Sale Price | Title Company |
|---|---|---|---|
| Saravia Nativi Carlos Enrique | $230,000 | None Available | |
| Montgomery Jeanne | $218,000 | -- | |
| Scott Lee Homes Inc A Nc Corp | $176,000 | -- | |
| Lee Brothers Rental | -- | -- |
Source: Public Records
Mortgage History
| Date | Status | Borrower | Loan Amount |
|---|---|---|---|
| Open | Saravia Nativi Carlos Enrique | $184,000 | |
| Previous Owner | Montgomery Jeanne | $221,460 |
Source: Public Records
Tax History
| Year | Tax Paid | Tax Assessment Tax Assessment Total Assessment is a certain percentage of the fair market value that is determined by local assessors to be the total taxable value of land and additions on the property. | Land | Improvement |
|---|---|---|---|---|
| 2025 | $2,284 | $359,750 | $65,000 | $294,750 |
| 2024 | $1,799 | $222,100 | $34,000 | $188,100 |
| 2023 | $1,710 | $222,100 | $34,000 | $188,100 |
| 2022 | $1,755 | $222,100 | $34,000 | $188,100 |
| 2021 | $1,755 | $222,100 | $34,000 | $188,100 |
| 2020 | $1,821 | $222,100 | $34,000 | $188,100 |
| 2019 | $1,821 | $222,100 | $34,000 | $188,100 |
| 2018 | $1,525 | $181,590 | $32,360 | $149,230 |
| 2017 | $1,481 | $176,320 | $32,360 | $143,960 |
| 2016 | $1,481 | $176,320 | $32,360 | $143,960 |
| 2015 | $1,481 | $176,320 | $32,360 | $143,960 |
| 2014 | $1,481 | $176,320 | $32,360 | $143,960 |
Source: Public Records
Map
Nearby Homes
- 312 Russ Rd
- 3649 Cleveland Rd
- 72 Shining Pearl Ct
- 11 Cashew Ln
- 491 Blaze Ridge Dr
- 4720 Cleveland Rd
- 241 Shiloh Woods Cir
- 313 Blaze Ridge Dr
- 240 Shiloh Woods Cir
- 222 Shiloh Woods Cir
- 205 Shiloh Woods Cir
- 204 Shiloh Woods Cir
- 140 Gobbler Dr
- 22 Iris Glen Ct
- 48 Iris Glen Ct
- 166 Shiloh Woods Cir
- 18 Gobbler Dr
- 120 Shiloh Woods Cir
- 122 Boss Shot Dr
- 164 Brodie Rose Landing Way
Your Personal Tour Guide
Ask me questions while you tour the home.