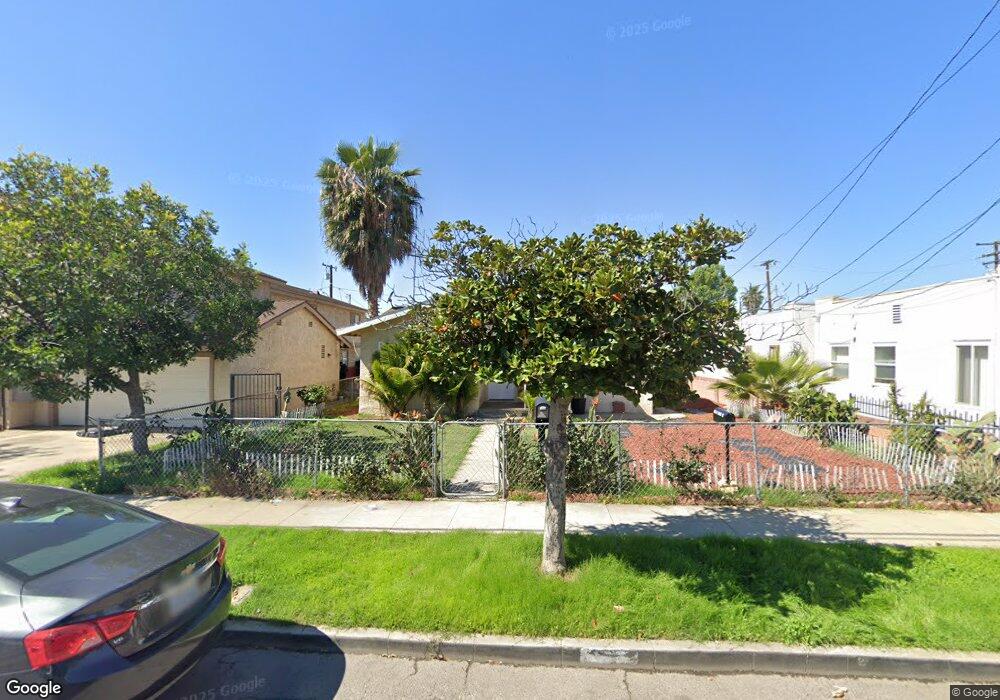
121 S Bluff Rd Montebello, CA 90640
Estimated Value: $1,187,000 - $1,248,291
3
Beds
5
Baths
2,717
Sq Ft
$446/Sq Ft
Est. Value
About This Home
This home is located at 121 S Bluff Rd, Montebello, CA 90640 and is currently estimated at $1,212,323, approximately $446 per square foot. 121 S Bluff Rd is a home located in Los Angeles County with nearby schools including Fremont Elementary School, La Merced Intermediate School, and Montebello High School.
Ownership History
Date
Name
Owned For
Owner Type
Purchase Details
Closed on
Aug 27, 2021
Sold by
Yao Yingquan
Bought by
Yao Yingquan and Zeng Wendi
Current Estimated Value
Purchase Details
Closed on
Nov 4, 2014
Sold by
He Xueqing
Bought by
He Xueqing and Jj Happy Trust
Purchase Details
Closed on
Apr 11, 2014
Sold by
Strauser Alicia
Bought by
He Xueqing
Purchase Details
Closed on
Mar 24, 2005
Sold by
Gastelum Belem
Bought by
Gastelum Belem and The Gastelum Living Trust
Create a Home Valuation Report for This Property
The Home Valuation Report is an in-depth analysis detailing your home's value as well as a comparison with similar homes in the area
Home Values in the Area
Average Home Value in this Area
Purchase History
| Date | Buyer | Sale Price | Title Company |
|---|---|---|---|
| Yao Yingquan | -- | Accommodation/Courtesy Recordi | |
| He Xueqing | -- | None Available | |
| He Xueqing | $290,000 | Old Republic Title Company | |
| Gastelum Belem | -- | -- |
Source: Public Records
Tax History
| Year | Tax Paid | Tax Assessment Tax Assessment Total Assessment is a certain percentage of the fair market value that is determined by local assessors to be the total taxable value of land and additions on the property. | Land | Improvement |
|---|---|---|---|---|
| 2025 | $16,082 | $1,116,495 | $531,664 | $584,831 |
| 2024 | $15,698 | $1,094,604 | $521,240 | $573,364 |
| 2023 | $15,675 | $1,073,142 | $511,020 | $562,122 |
| 2022 | $15,145 | $1,052,100 | $501,000 | $551,100 |
| 2021 | $8,498 | $572,724 | $262,737 | $309,987 |
| 2020 | $5,067 | $325,052 | $260,043 | $65,009 |
| 2019 | $4,924 | $318,680 | $254,945 | $63,735 |
| 2018 | $4,938 | $312,433 | $249,947 | $62,486 |
| 2016 | $4,731 | $300,303 | $240,243 | $60,060 |
| 2015 | $4,486 | $295,793 | $236,635 | $59,158 |
| 2014 | $4,914 | $326,475 | $226,021 | $100,454 |
Source: Public Records
Map
Nearby Homes
- 132 N 2nd St
- 416 W Cleveland Ave
- 4739 Ivy St
- 252 S 7th St
- 405 S Bluff Rd
- 4753 Orange St
- 344 N 1st St
- 4724 Orange St
- 272 Maiden Ln
- 415 S 6th St
- 424 Bradley Ave
- 229 S 10th St
- 219 S Greenwood Ave
- 133 N Greenwood Ave
- 862 W Mines Ave
- 649 S 5th St
- 8630 Elba St
- 217 Dochan Cir
- 4660 Paramount Blvd
- 608 Davis Ave
Your Personal Tour Guide
Ask me questions while you tour the home.