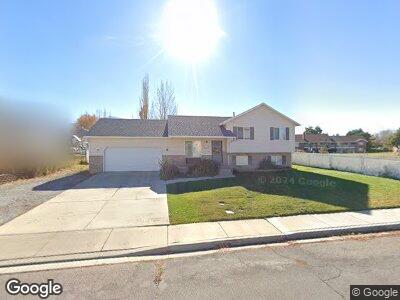
121 W 690 N Santaquin, UT 84655
Estimated Value: $430,000 - $453,294
3
Beds
3
Baths
1,088
Sq Ft
$404/Sq Ft
Est. Value
About This Home
This home is located at 121 W 690 N, Santaquin, UT 84655 and is currently estimated at $440,074, approximately $404 per square foot. 121 W 690 N is a home located in Utah County with nearby schools including Apple Valley Elementary, Payson Junior High School, and Payson High School.
Ownership History
Date
Name
Owned For
Owner Type
Purchase Details
Closed on
Feb 23, 2001
Sold by
Short Robert W and Short Natalie W
Bought by
Short Robert W and Short Natalie
Current Estimated Value
Home Financials for this Owner
Home Financials are based on the most recent Mortgage that was taken out on this home.
Original Mortgage
$123,500
Interest Rate
6.98%
Purchase Details
Closed on
Jan 12, 2000
Sold by
C & J Development Llc
Bought by
Short Robert W and Short Natalie W
Home Financials for this Owner
Home Financials are based on the most recent Mortgage that was taken out on this home.
Original Mortgage
$117,200
Interest Rate
7.83%
Mortgage Type
Seller Take Back
Create a Home Valuation Report for This Property
The Home Valuation Report is an in-depth analysis detailing your home's value as well as a comparison with similar homes in the area
Home Values in the Area
Average Home Value in this Area
Purchase History
| Date | Buyer | Sale Price | Title Company |
|---|---|---|---|
| Short Robert W | -- | Associated Title Company | |
| Short Robert W | -- | Wasatch Land & Title |
Source: Public Records
Mortgage History
| Date | Status | Borrower | Loan Amount |
|---|---|---|---|
| Open | Short Robert W | $163,020 | |
| Closed | Short Robert W | $167,144 | |
| Closed | Short Robert W | $141,600 | |
| Closed | Short Robert W | $17,700 | |
| Closed | Short Robert W | $123,500 | |
| Closed | Short Robert W | $117,200 |
Source: Public Records
Tax History Compared to Growth
Tax History
| Year | Tax Paid | Tax Assessment Tax Assessment Total Assessment is a certain percentage of the fair market value that is determined by local assessors to be the total taxable value of land and additions on the property. | Land | Improvement |
|---|---|---|---|---|
| 2024 | $2,035 | $202,675 | $0 | $0 |
| 2023 | $2,112 | $210,980 | $0 | $0 |
| 2022 | $2,091 | $215,435 | $0 | $0 |
| 2021 | $1,776 | $283,600 | $78,500 | $205,100 |
| 2020 | $1,703 | $263,600 | $68,300 | $195,300 |
| 2019 | $1,504 | $238,100 | $68,300 | $169,800 |
| 2018 | $1,384 | $208,900 | $59,700 | $149,200 |
| 2017 | $1,332 | $107,415 | $0 | $0 |
| 2016 | $1,245 | $98,340 | $0 | $0 |
| 2015 | $1,189 | $92,180 | $0 | $0 |
| 2014 | $1,085 | $83,930 | $0 | $0 |
Source: Public Records
Map
Nearby Homes