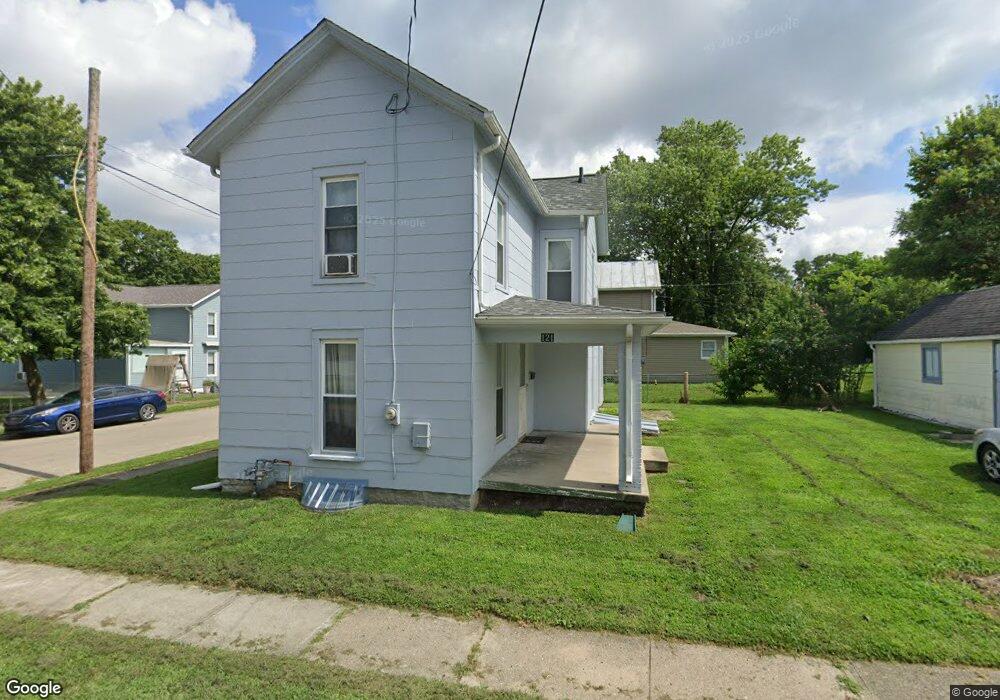
121 W 8th St Franklin, OH 45005
Estimated Value: $112,000 - $160,000
2
Beds
2
Baths
1,156
Sq Ft
$123/Sq Ft
Est. Value
About This Home
This home is located at 121 W 8th St, Franklin, OH 45005 and is currently estimated at $142,166, approximately $122 per square foot. 121 W 8th St is a home located in Warren County with nearby schools including Franklin High School.
Ownership History
Date
Name
Owned For
Owner Type
Purchase Details
Closed on
Jul 18, 2007
Sold by
Va
Bought by
Kindred Thomas E
Current Estimated Value
Home Financials for this Owner
Home Financials are based on the most recent Mortgage that was taken out on this home.
Original Mortgage
$56,700
Outstanding Balance
$35,790
Interest Rate
6.69%
Mortgage Type
Purchase Money Mortgage
Estimated Equity
$106,376
Purchase Details
Closed on
Aug 30, 2006
Sold by
Wills Jeffrey L and Wills Angel
Bought by
Va
Purchase Details
Closed on
Dec 11, 1998
Sold by
Cockerham Sterling
Bought by
Wills Jeffrey L
Home Financials for this Owner
Home Financials are based on the most recent Mortgage that was taken out on this home.
Original Mortgage
$70,450
Interest Rate
6.93%
Mortgage Type
VA
Purchase Details
Closed on
Jan 7, 1988
Sold by
Cox Cox and Cox Dora
Bought by
Cockerham Cockerham and Cockerham Sterling
Purchase Details
Closed on
Jun 19, 1978
Sold by
Schilder Schilder and Schilder Ruth Kadle
Create a Home Valuation Report for This Property
The Home Valuation Report is an in-depth analysis detailing your home's value as well as a comparison with similar homes in the area
Home Values in the Area
Average Home Value in this Area
Purchase History
| Date | Buyer | Sale Price | Title Company |
|---|---|---|---|
| Kindred Thomas E | -- | Landmark Title Agency S Inc | |
| Va | -- | Accutitle Agency | |
| Wills Jeffrey L | $69,100 | -- | |
| Cockerham Cockerham | $24,600 | -- | |
| -- | $15,000 | -- |
Source: Public Records
Mortgage History
| Date | Status | Borrower | Loan Amount |
|---|---|---|---|
| Open | Kindred Thomas E | $56,700 | |
| Previous Owner | Wills Jeffrey L | $70,450 |
Source: Public Records
Tax History Compared to Growth
Tax History
| Year | Tax Paid | Tax Assessment Tax Assessment Total Assessment is a certain percentage of the fair market value that is determined by local assessors to be the total taxable value of land and additions on the property. | Land | Improvement |
|---|---|---|---|---|
| 2024 | $1,835 | $37,070 | $7,830 | $29,240 |
| 2023 | $1,532 | $28,343 | $4,441 | $23,901 |
| 2022 | $1,504 | $28,343 | $4,442 | $23,902 |
| 2021 | $1,428 | $28,343 | $4,442 | $23,902 |
| 2020 | $1,290 | $22,495 | $3,525 | $18,970 |
| 2019 | $1,177 | $22,495 | $3,525 | $18,970 |
| 2018 | $1,116 | $22,495 | $3,525 | $18,970 |
| 2017 | $1,235 | $21,592 | $3,385 | $18,207 |
| 2016 | $1,258 | $21,592 | $3,385 | $18,207 |
| 2015 | $1,258 | $21,592 | $3,385 | $18,207 |
| 2014 | $1,227 | $21,590 | $3,380 | $18,210 |
| 2013 | $1,054 | $24,980 | $3,920 | $21,060 |
Source: Public Records
Map
Nearby Homes
- 820 S River St
- 631 S River St
- 235 S Main St
- 233 S Main St
- 1200 Riley Blvd
- 1007 S River St
- 1010 S Main St
- 521 S Main St
- 519 Anderson St
- 0 E 4th St
- 121 E 5th St
- 410 Park Ave
- 441 Sunnybrook Dr
- 509 Forest Ave
- 511 Forest Ave
- 418 Home Ave
- 521 Spring Ave
- 0 Kathy Ln Unit 1834240
- 0 Kathy Ln Unit 930066
- 605 Spring Ave