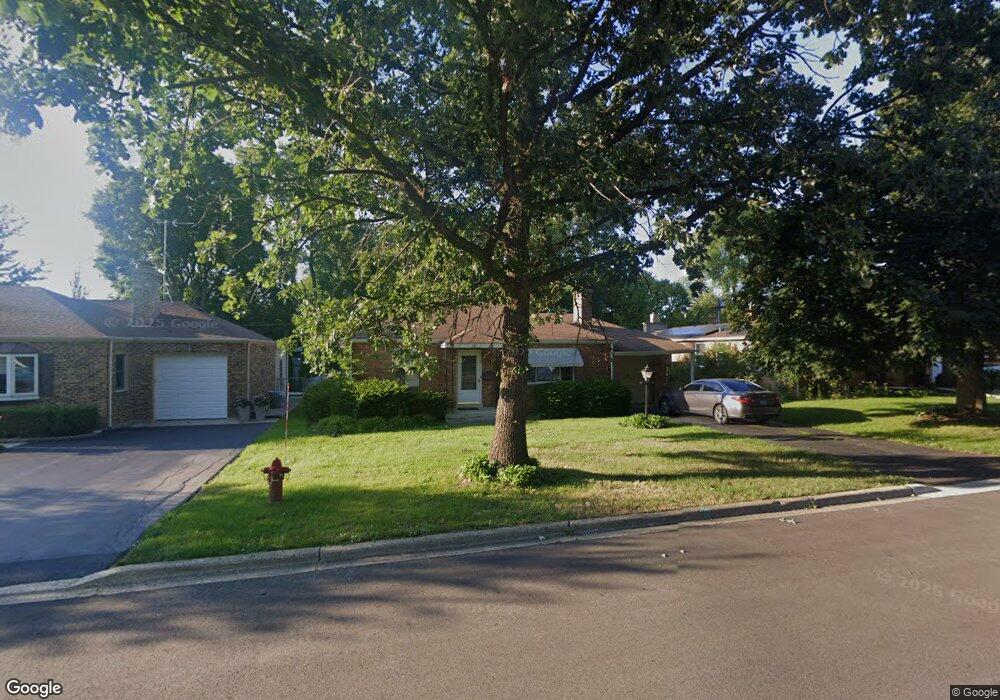
121 W Church St Wauconda, IL 60084
Estimated Value: $211,430 - $244,000
--
Bed
1
Bath
936
Sq Ft
$243/Sq Ft
Est. Value
About This Home
This home is located at 121 W Church St, Wauconda, IL 60084 and is currently estimated at $227,608, approximately $243 per square foot. 121 W Church St is a home located in Lake County with nearby schools including Wauconda Grade School, Wauconda Middle School, and Wauconda High School.
Ownership History
Date
Name
Owned For
Owner Type
Purchase Details
Closed on
Feb 8, 2011
Sold by
Altmann Joseph A and Altmann Kathryn
Bought by
Kelsey Properties Llc
Current Estimated Value
Purchase Details
Closed on
Nov 18, 2010
Sold by
Kelsey Properties Llc
Bought by
Altmann Joseph A and Altmann Kathryn
Purchase Details
Closed on
Mar 21, 2005
Sold by
Altmann Joseph A and Altmann Kathryn J
Bought by
Kelsey Properties Llc
Purchase Details
Closed on
Jul 30, 2001
Sold by
Miller Wayne J
Bought by
Altmann Joseph A and Altmann Kathryn J
Home Financials for this Owner
Home Financials are based on the most recent Mortgage that was taken out on this home.
Original Mortgage
$196,000
Interest Rate
7.5%
Purchase Details
Closed on
Mar 7, 2000
Sold by
Cesnavicius Anthonia T and Gecas Bertha S
Bought by
Cesnavicius Anthonia and Anthonia Cesnavicius Trust #1
Create a Home Valuation Report for This Property
The Home Valuation Report is an in-depth analysis detailing your home's value as well as a comparison with similar homes in the area
Home Values in the Area
Average Home Value in this Area
Purchase History
| Date | Buyer | Sale Price | Title Company |
|---|---|---|---|
| Kelsey Properties Llc | -- | None Available | |
| Altmann Joseph A | -- | None Available | |
| Kelsey Properties Llc | -- | -- | |
| Altmann Joseph A | $128,000 | -- | |
| Cesnavicius Anthonia | -- | -- |
Source: Public Records
Mortgage History
| Date | Status | Borrower | Loan Amount |
|---|---|---|---|
| Previous Owner | Altmann Joseph A | $196,000 |
Source: Public Records
Tax History Compared to Growth
Tax History
| Year | Tax Paid | Tax Assessment Tax Assessment Total Assessment is a certain percentage of the fair market value that is determined by local assessors to be the total taxable value of land and additions on the property. | Land | Improvement |
|---|---|---|---|---|
| 2024 | $5,054 | $56,269 | $15,992 | $40,277 |
| 2023 | $5,045 | $51,434 | $14,618 | $36,816 |
| 2022 | $5,045 | $46,233 | $14,679 | $31,554 |
| 2021 | $4,836 | $43,686 | $13,870 | $29,816 |
| 2020 | $4,698 | $41,638 | $13,220 | $28,418 |
| 2019 | $4,188 | $39,352 | $12,494 | $26,858 |
| 2018 | $4,980 | $43,290 | $14,525 | $28,765 |
| 2017 | $4,978 | $42,789 | $14,357 | $28,432 |
| 2016 | $4,696 | $40,520 | $13,596 | $26,924 |
| 2015 | $4,448 | $37,198 | $12,481 | $24,717 |
| 2014 | $3,910 | $34,096 | $14,615 | $19,481 |
| 2012 | $3,784 | $33,489 | $13,983 | $19,506 |
Source: Public Records
Map
Nearby Homes
- 136 Hubbard Ct
- 125 E Mill St Unit D103
- 226 Barrington Rd
- 300 Barrington Rd
- 146 E Mill St
- 131 E Mill St Unit B104
- 431 Barrington Rd
- 311 Brown St
- 435 Barrington Rd
- 318 E Liberty St
- 450 N Main St Unit S307A
- 450 N Main St Unit S208A
- 107 Hammond Ave
- 25721 W Lakeview Ave
- 335 Farmhill Cir
- 25586 W High St
- 25578 W High St
- 25570 W High St
- 325 Sundown Ct Unit B
- 651 W Liberty St Unit B
- 127 W Church St
- 109 W Church St
- 133 W Church St
- 140 W Maple Ave
- 136 W Maple Ave
- 146 W Maple Ave
- 105 W Church St
- 152 W Maple Ave
- 120 W Church St
- 130 W Maple Ave
- 137 W Church St
- 116 W Church St
- 126 W Church St
- 110 W Church St
- 130 W Church St
- 156 W Maple Ave
- 122 W Maple Ave
- 301 Bangs St
- 136 W Church St
- 101 W Church St