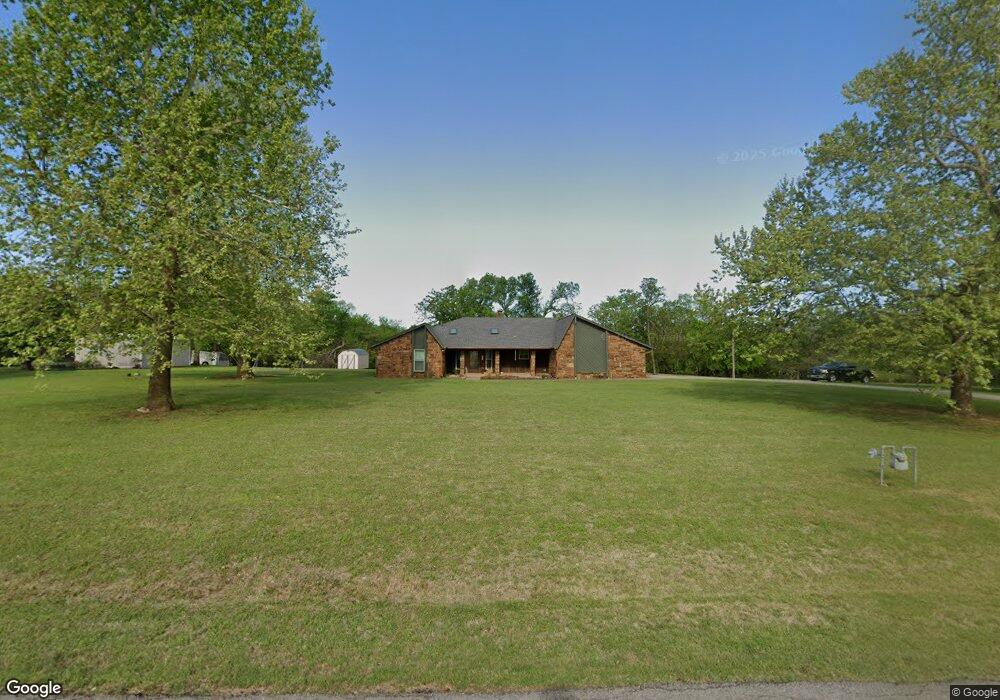
121 Worley Creek Ln Tuttle, OK 73089
Estimated Value: $338,000 - $411,000
3
Beds
2
Baths
2,393
Sq Ft
$156/Sq Ft
Est. Value
About This Home
This home is located at 121 Worley Creek Ln, Tuttle, OK 73089 and is currently estimated at $373,128, approximately $155 per square foot. 121 Worley Creek Ln is a home located in Grady County with nearby schools including Tuttle Elementary School, Tuttle Intermediate School, and Tuttle Middle School.
Ownership History
Date
Name
Owned For
Owner Type
Purchase Details
Closed on
Apr 1, 2022
Sold by
Williams Christina S and Williams Wesley J
Bought by
Marshell Jason W and Marshell Tommie D
Current Estimated Value
Home Financials for this Owner
Home Financials are based on the most recent Mortgage that was taken out on this home.
Original Mortgage
$199,000
Outstanding Balance
$187,432
Interest Rate
4.67%
Mortgage Type
Balloon
Estimated Equity
$185,696
Purchase Details
Closed on
May 13, 2005
Sold by
Williams Christine S and Sowell Crissy B
Bought by
Williams Christina S and Williams Wesley J
Home Financials for this Owner
Home Financials are based on the most recent Mortgage that was taken out on this home.
Original Mortgage
$196,000
Interest Rate
5.92%
Mortgage Type
New Conventional
Purchase Details
Closed on
Apr 7, 2003
Sold by
Sheppard James R and Sheppard Donna
Bought by
Sowell Crissy B
Create a Home Valuation Report for This Property
The Home Valuation Report is an in-depth analysis detailing your home's value as well as a comparison with similar homes in the area
Home Values in the Area
Average Home Value in this Area
Purchase History
| Date | Buyer | Sale Price | Title Company |
|---|---|---|---|
| Marshell Jason W | $275,000 | First American Title | |
| Williams Christina S | -- | Ward Title & Closing Co | |
| Sowell Crissy B | $170,000 | -- |
Source: Public Records
Mortgage History
| Date | Status | Borrower | Loan Amount |
|---|---|---|---|
| Open | Marshell Jason W | $199,000 | |
| Previous Owner | Williams Christina S | $196,000 |
Source: Public Records
Tax History Compared to Growth
Tax History
| Year | Tax Paid | Tax Assessment Tax Assessment Total Assessment is a certain percentage of the fair market value that is determined by local assessors to be the total taxable value of land and additions on the property. | Land | Improvement |
|---|---|---|---|---|
| 2025 | $3,513 | $33,350 | $4,631 | $28,719 |
| 2024 | $3,608 | $31,762 | $4,411 | $27,351 |
| 2023 | $3,608 | $30,250 | $5,412 | $24,838 |
| 2022 | $2,333 | $22,237 | $5,412 | $16,825 |
| 2021 | $2,383 | $22,610 | $5,287 | $17,323 |
| 2020 | $2,352 | $22,103 | $4,136 | $17,967 |
| 2019 | $2,264 | $21,678 | $3,356 | $18,322 |
| 2018 | $2,073 | $21,046 | $3,364 | $17,682 |
| 2017 | $2,062 | $20,434 | $2,994 | $17,440 |
| 2016 | $2,036 | $19,839 | $2,504 | $17,335 |
| 2015 | $1,813 | $19,261 | $1,941 | $17,320 |
| 2014 | $1,813 | $18,700 | $1,008 | $17,692 |
Source: Public Records
Map
Nearby Homes
- 2803 E Sh-37
- 825 S Cemetery Rd
- 811 S Cemetery Rd
- 3600 E 37 Hwy
- 803 S Cemetery Rd
- 813 S Cemetery Rd
- 827 S Cemetery Rd
- 215 N Cemetery Rd
- 408 Red Rock Rd
- 410 Sky Ln
- 4 Willow Creek Dr
- 834 Tall Pines Dr
- N Czech Hall Rd
- 1107 Prairie Hills Dr
- 5600 E Tyler Dr
- 1111 Colonial Ave
- 1124 Colonial Ave
- 1127 Deer Ridge
- 4220 Caribou St
- 101 Pinewood Dr
- 111 Worley Creek Ln
- 112 Worley Creek Ln
- 202 Worley Creek Ln
- 203 Worley Creek Ln
- 1453 County Street 2910
- 110 Worley Creek Ln
- 3017 E Highway 37
- 107 Worley Creek Ln
- 3221 E Highway 37
- 3219 E Highway 37
- 0 Hwy 37 Unit 1015274
- 305 Atlas Dr
- 3316 Fryrear Dr
- 207 Worley Creek Dr
- 103 Worley Creek Dr
- 101 Worley Creek Dr
- 0000 E Highway 37
- 121 N Cemetery Rd
- 25 N Cemetery Rd
- 1 N Cemetery Rd