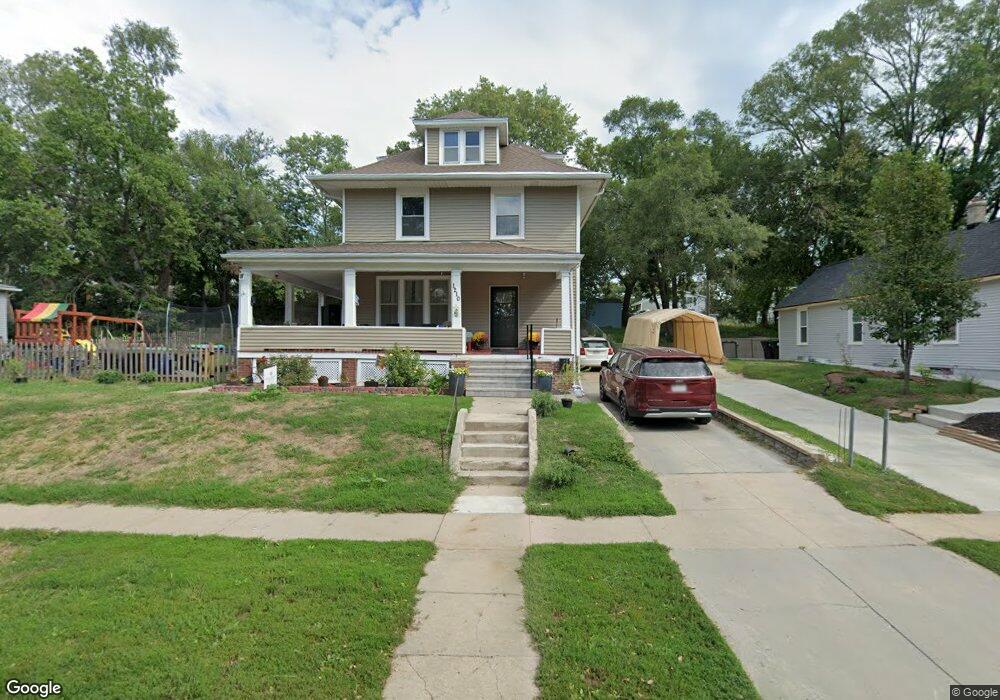
1210 Atlas St Omaha, NE 68107
South Central Omaha NeighborhoodEstimated Value: $224,000 - $260,000
4
Beds
4
Baths
2,163
Sq Ft
$109/Sq Ft
Est. Value
About This Home
This home is located at 1210 Atlas St, Omaha, NE 68107 and is currently estimated at $236,505, approximately $109 per square foot. 1210 Atlas St is a home located in Douglas County with nearby schools including Spring Lake Magnet Center, R.M. Marrs Magnet Middle School, and South High School.
Ownership History
Date
Name
Owned For
Owner Type
Purchase Details
Closed on
Apr 30, 2018
Sold by
Charnquist Heidi and Ludwick Adam
Bought by
Desantiago Joseph R and Desantiago Brianne M
Current Estimated Value
Home Financials for this Owner
Home Financials are based on the most recent Mortgage that was taken out on this home.
Original Mortgage
$133,000
Outstanding Balance
$114,649
Interest Rate
4.45%
Mortgage Type
New Conventional
Estimated Equity
$121,856
Purchase Details
Closed on
Jun 2, 2006
Sold by
Mcelroy G
Bought by
Charnquist Timothy
Create a Home Valuation Report for This Property
The Home Valuation Report is an in-depth analysis detailing your home's value as well as a comparison with similar homes in the area
Home Values in the Area
Average Home Value in this Area
Purchase History
| Date | Buyer | Sale Price | Title Company |
|---|---|---|---|
| Desantiago Joseph R | $140,000 | Nebraska Title Co | |
| Charnquist Timothy | $79,500 | -- |
Source: Public Records
Mortgage History
| Date | Status | Borrower | Loan Amount |
|---|---|---|---|
| Open | Desantiago Joseph R | $133,000 |
Source: Public Records
Tax History Compared to Growth
Tax History
| Year | Tax Paid | Tax Assessment Tax Assessment Total Assessment is a certain percentage of the fair market value that is determined by local assessors to be the total taxable value of land and additions on the property. | Land | Improvement |
|---|---|---|---|---|
| 2024 | $4,258 | $201,800 | $23,000 | $178,800 |
| 2023 | $4,258 | $201,800 | $23,000 | $178,800 |
| 2022 | $3,588 | $168,100 | $19,700 | $148,400 |
| 2021 | $3,418 | $161,500 | $19,700 | $141,800 |
| 2020 | $2,867 | $133,900 | $19,700 | $114,200 |
| 2019 | $2,414 | $112,400 | $6,900 | $105,500 |
| 2018 | $1,978 | $92,000 | $6,900 | $85,100 |
| 2017 | $1,988 | $92,000 | $6,900 | $85,100 |
| 2016 | $1,974 | $92,000 | $6,900 | $85,100 |
| 2015 | $1,948 | $92,000 | $6,900 | $85,100 |
| 2014 | $1,948 | $92,000 | $6,900 | $85,100 |
Source: Public Records
Map
Nearby Homes