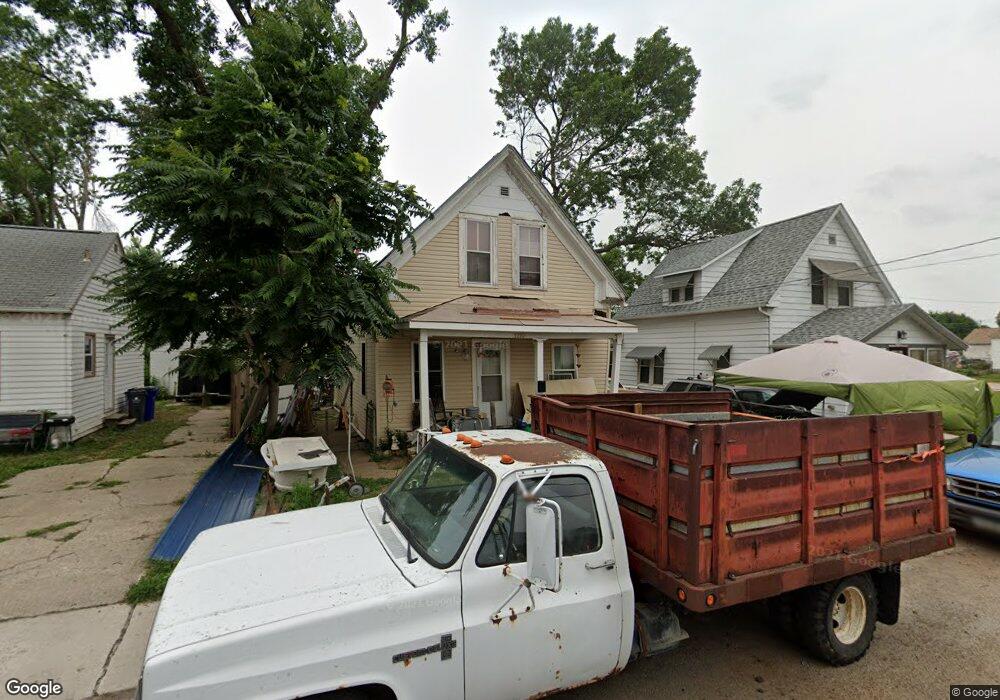
1210 M St SW Cedar Rapids, IA 52404
Taylor NeighborhoodEstimated Value: $100,000 - $125,000
2
Beds
2
Baths
900
Sq Ft
$122/Sq Ft
Est. Value
About This Home
This home is located at 1210 M St SW, Cedar Rapids, IA 52404 and is currently estimated at $109,437, approximately $121 per square foot. 1210 M St SW is a home located in Linn County with nearby schools including Cedar River Academy at Taylor Elementary School, Wilson Middle School, and Thomas Jefferson High School.
Ownership History
Date
Name
Owned For
Owner Type
Purchase Details
Closed on
Aug 18, 2010
Sold by
Us Bank Na
Bought by
Melichar Robert J
Current Estimated Value
Purchase Details
Closed on
May 18, 2010
Sold by
Horning Kelly A
Bought by
Us Bank Na
Purchase Details
Closed on
May 31, 2001
Sold by
Fare Sarah and Fare Jay Allen
Bought by
Horning Kelly A
Home Financials for this Owner
Home Financials are based on the most recent Mortgage that was taken out on this home.
Original Mortgage
$55,750
Interest Rate
7.23%
Create a Home Valuation Report for This Property
The Home Valuation Report is an in-depth analysis detailing your home's value as well as a comparison with similar homes in the area
Home Values in the Area
Average Home Value in this Area
Purchase History
| Date | Buyer | Sale Price | Title Company |
|---|---|---|---|
| Melichar Robert J | $12,000 | None Available | |
| Us Bank Na | $59,802 | None Available | |
| Horning Kelly A | $57,000 | -- |
Source: Public Records
Mortgage History
| Date | Status | Borrower | Loan Amount |
|---|---|---|---|
| Previous Owner | Horning Kelly A | $55,750 |
Source: Public Records
Tax History
| Year | Tax Paid | Tax Assessment Tax Assessment Total Assessment is a certain percentage of the fair market value that is determined by local assessors to be the total taxable value of land and additions on the property. | Land | Improvement |
|---|---|---|---|---|
| 2025 | $1,304 | $94,200 | $26,500 | $67,700 |
| 2024 | $88 | $86,500 | $24,500 | $62,000 |
| 2023 | $88 | $84,100 | $24,500 | $59,600 |
| 2022 | $88 | $73,400 | $20,400 | $53,000 |
| 2021 | $1,352 | $67,200 | $20,400 | $46,800 |
| 2020 | $1,316 | $61,300 | $18,400 | $42,900 |
| 2019 | $1,288 | $59,800 | $18,400 | $41,400 |
| 2018 | $1,170 | $59,800 | $18,400 | $41,400 |
| 2017 | $1,294 | $59,400 | $18,400 | $41,000 |
| 2016 | $1,096 | $51,600 | $15,600 | $36,000 |
| 2015 | $1,130 | $53,148 | $15,606 | $37,542 |
| 2014 | $1,130 | $53,148 | $15,606 | $37,542 |
| 2013 | $1,106 | $53,148 | $15,606 | $37,542 |
Source: Public Records
Map
Nearby Homes
Your Personal Tour Guide
Ask me questions while you tour the home.