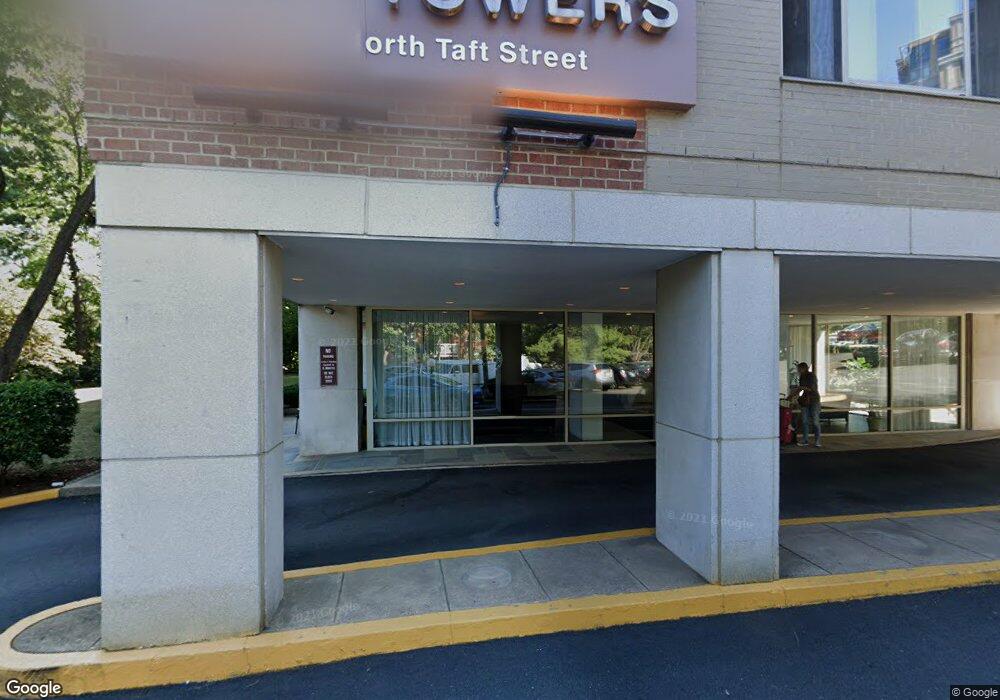
Taft Towers 1210 N Taft St Unit 202 Arlington, VA 22201
Clarendon/Courthouse NeighborhoodEstimated Value: $410,666 - $583,000
2
Beds
1
Bath
1,016
Sq Ft
$472/Sq Ft
Est. Value
About This Home
This home is located at 1210 N Taft St Unit 202, Arlington, VA 22201 and is currently estimated at $479,167, approximately $471 per square foot. 1210 N Taft St Unit 202 is a home located in Arlington County with nearby schools including Francis Scott Key Elementary School, Dorothy Hamm Middle School, and Yorktown High School.
Ownership History
Date
Name
Owned For
Owner Type
Purchase Details
Closed on
Feb 28, 2011
Sold by
Stimers Ralph S
Bought by
Kinnard Sean M
Current Estimated Value
Home Financials for this Owner
Home Financials are based on the most recent Mortgage that was taken out on this home.
Original Mortgage
$263,200
Outstanding Balance
$180,503
Interest Rate
4.75%
Mortgage Type
New Conventional
Estimated Equity
$298,664
Purchase Details
Closed on
Nov 5, 2004
Sold by
Krody Eric
Bought by
Stimers Ralph
Home Financials for this Owner
Home Financials are based on the most recent Mortgage that was taken out on this home.
Original Mortgage
$300,000
Interest Rate
5.71%
Mortgage Type
New Conventional
Purchase Details
Closed on
Jan 31, 1995
Sold by
Assoc Reloc Mgmt Co
Bought by
Krody Eric
Home Financials for this Owner
Home Financials are based on the most recent Mortgage that was taken out on this home.
Original Mortgage
$51,750
Interest Rate
9.24%
Create a Home Valuation Report for This Property
The Home Valuation Report is an in-depth analysis detailing your home's value as well as a comparison with similar homes in the area
Home Values in the Area
Average Home Value in this Area
Purchase History
| Date | Buyer | Sale Price | Title Company |
|---|---|---|---|
| Kinnard Sean M | $329,000 | -- | |
| Stimers Ralph | $375,000 | -- | |
| Krody Eric | $71,019 | -- | |
| Assoc Reloc Mgmt Co Inc | $72,250 | -- |
Source: Public Records
Mortgage History
| Date | Status | Borrower | Loan Amount |
|---|---|---|---|
| Open | Kinnard Sean M | $263,200 | |
| Previous Owner | Stimers Ralph | $300,000 | |
| Previous Owner | Assoc Reloc Mgmt Co Inc | $51,750 |
Source: Public Records
Tax History Compared to Growth
Tax History
| Year | Tax Paid | Tax Assessment Tax Assessment Total Assessment is a certain percentage of the fair market value that is determined by local assessors to be the total taxable value of land and additions on the property. | Land | Improvement |
|---|---|---|---|---|
| 2025 | $4,001 | $387,300 | $88,400 | $298,900 |
| 2024 | $3,911 | $378,600 | $88,400 | $290,200 |
| 2023 | $3,900 | $378,600 | $88,400 | $290,200 |
| 2022 | $3,900 | $378,600 | $88,400 | $290,200 |
| 2021 | $3,900 | $378,600 | $88,400 | $290,200 |
| 2020 | $3,664 | $357,100 | $40,600 | $316,500 |
| 2019 | $3,632 | $354,000 | $40,600 | $313,400 |
| 2018 | $3,561 | $354,000 | $40,600 | $313,400 |
| 2017 | $3,500 | $347,900 | $40,600 | $307,300 |
| 2016 | $3,050 | $307,800 | $40,600 | $267,200 |
| 2015 | $3,066 | $307,800 | $40,600 | $267,200 |
| 2014 | $3,066 | $307,800 | $40,600 | $267,200 |
Source: Public Records
About Taft Towers
Map
Nearby Homes
- 1301 N Courthouse Rd Unit 1108
- 1301 N Courthouse Rd Unit 611
- 1301 N Courthouse Rd Unit 1401
- 1301 N Courthouse Rd Unit 705
- 1301 N Courthouse Rd Unit 1507
- 1301 N Courthouse Rd Unit 1810
- 1730 Arlington Blvd Unit 209
- 2227 12th Ct N
- 2220 Fairfax Dr Unit 608
- 2220 Fairfax Dr Unit 101
- 2220 Fairfax Dr Unit 707
- 1811 14th St N Unit 104
- 1504 N Scott St Unit TH2
- 2001 15th St N Unit 111
- 2001 15th St N Unit 306
- 2001 15th St N Unit 420
- 2001 15th St N Unit 506
- 2001 15th St N Unit 1008
- 2001 15th St N Unit 813
- 1418 N Rhodes St Unit B105
- 1210 N Taft St
- 1210 N Taft St Unit 105
- 1210 N Taft St Unit 908
- 1210 N Taft St Unit 711
- 1210 N Taft St Unit 100
- 1210 N Taft St Unit 611
- 1210 N Taft St Unit 304
- 1210 N Taft St Unit 806
- 1210 N Taft St Unit 811
- 1210 N Taft St Unit 912
- 1210 N Taft St Unit 507
- 1210 N Taft St Unit 905
- 1210 N Taft St Unit 503
- 1210 N Taft St Unit 504
- 1210 N Taft St Unit 306
- 1210 N Taft St Unit 401
- 1210 N Taft St Unit 901
- 1210 N Taft St Unit 606
- 1210 N Taft St Unit 203
- 1210 N Taft St Unit 702