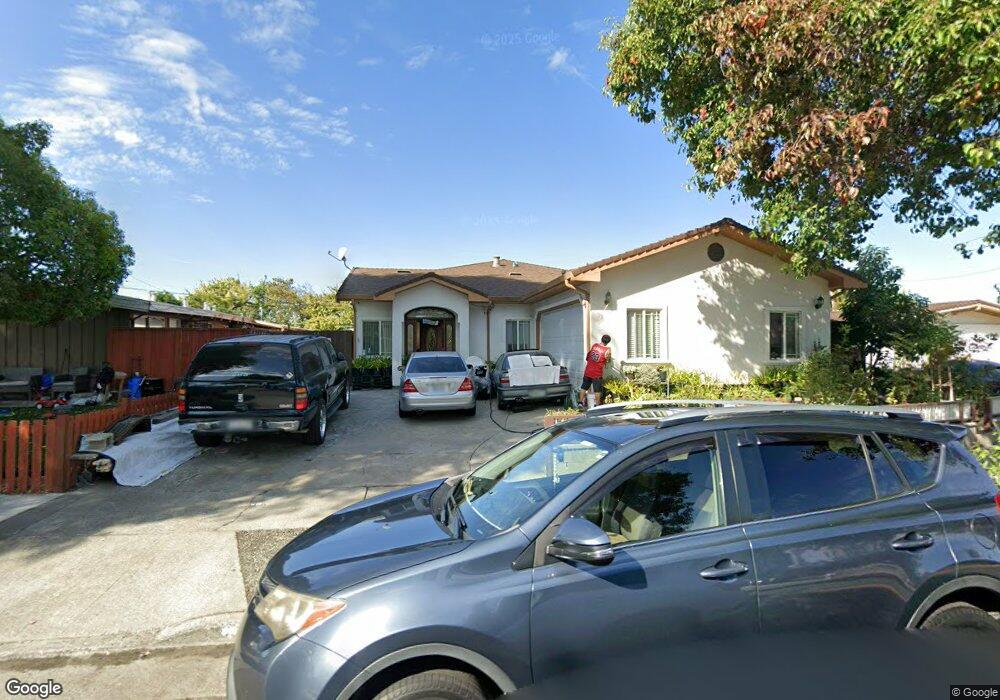
1210 Oak Creek Way Sunnyvale, CA 94089
Lakewood NeighborhoodEstimated Value: $1,524,000 - $1,854,000
5
Beds
3
Baths
1,000
Sq Ft
$1,728/Sq Ft
Est. Value
About This Home
This home is located at 1210 Oak Creek Way, Sunnyvale, CA 94089 and is currently estimated at $1,728,148, approximately $1,728 per square foot. 1210 Oak Creek Way is a home located in Santa Clara County with nearby schools including Fairwood Elementary School, Columbia Middle School, and Fremont High School.
Ownership History
Date
Name
Owned For
Owner Type
Purchase Details
Closed on
Oct 16, 2009
Sold by
Delos Santos Mendel and De Los Santos Jennifer
Bought by
Delos Santos Mendel and Delos Santos Jennifer
Current Estimated Value
Purchase Details
Closed on
Feb 7, 2006
Sold by
Delos Santos Mendel
Bought by
Delos Santos Mendel and Delos Santos Jennifer
Home Financials for this Owner
Home Financials are based on the most recent Mortgage that was taken out on this home.
Original Mortgage
$512,000
Outstanding Balance
$299,329
Interest Rate
1.5%
Mortgage Type
Purchase Money Mortgage
Estimated Equity
$1,428,819
Purchase Details
Closed on
Aug 2, 2001
Sold by
Suter Ralph James
Bought by
Delossantos Mendel
Home Financials for this Owner
Home Financials are based on the most recent Mortgage that was taken out on this home.
Original Mortgage
$367,200
Interest Rate
7.62%
Create a Home Valuation Report for This Property
The Home Valuation Report is an in-depth analysis detailing your home's value as well as a comparison with similar homes in the area
Home Values in the Area
Average Home Value in this Area
Purchase History
| Date | Buyer | Sale Price | Title Company |
|---|---|---|---|
| Delos Santos Mendel | -- | None Available | |
| Delos Santos Mendel | -- | Alliance Title Company | |
| Delossantos Mendel | $408,000 | Chicago Title Co |
Source: Public Records
Mortgage History
| Date | Status | Borrower | Loan Amount |
|---|---|---|---|
| Open | Delos Santos Mendel | $512,000 | |
| Closed | Delossantos Mendel | $367,200 |
Source: Public Records
Tax History Compared to Growth
Tax History
| Year | Tax Paid | Tax Assessment Tax Assessment Total Assessment is a certain percentage of the fair market value that is determined by local assessors to be the total taxable value of land and additions on the property. | Land | Improvement |
|---|---|---|---|---|
| 2025 | $9,166 | $795,882 | $517,047 | $278,835 |
| 2024 | $9,166 | $780,277 | $506,909 | $273,368 |
| 2023 | $9,059 | $764,978 | $496,970 | $268,008 |
| 2022 | $8,888 | $749,979 | $487,226 | $262,753 |
| 2021 | $8,796 | $735,274 | $477,673 | $257,601 |
| 2020 | $8,684 | $727,736 | $472,776 | $254,960 |
| 2019 | $8,491 | $713,467 | $463,506 | $249,961 |
| 2018 | $8,322 | $699,478 | $454,418 | $245,060 |
| 2017 | $8,214 | $685,763 | $445,508 | $240,255 |
| 2016 | $7,874 | $672,318 | $436,773 | $235,545 |
| 2015 | $7,919 | $662,220 | $430,213 | $232,007 |
| 2014 | $6,788 | $566,000 | $367,700 | $198,300 |
Source: Public Records
Map
Nearby Homes
- 1269 Manzano Way
- 1199 Blazingwood Dr
- 1101 Palamos Ave
- 1220 Tasman Dr Unit 7
- 1220 Tasman Dr Unit 432
- 1220 Tasman Dr
- 1220 Tasman Dr Unit 128
- 1220 Tasman Dr Unit 558
- 1220 Tasman Dr Unit 304
- 1220 Tasman Dr Unit 124
- 1220 Tasman Dr Unit 39
- 1017 Lakedale Way
- 1189 Skylake Ct
- 1225 Vienna Dr Unit 937
- 1225 Vienna Dr Unit 604
- 1225 Vienna Dr Unit 550
- 1225 Vienna Dr Unit 942
- 1225 Vienna Dr Unit 1
- 1225 Vienna Dr Unit 980
- 1225 Vienna Dr Unit 402
- 1212 Oak Creek Way
- 1208 Oak Creek Way
- 1211 Oak Creek Way
- 1209 Oak Creek Way
- 1216 Oak Creek Way
- 1213 Oak Creek Way
- 1215 Oak Creek Way
- 1218 Oak Creek Way
- 1217 Oak Creek Way
- 1210 Manzano Way
- 1208 Manzano Way
- 1212 Manzano Way
- 1220 Oak Creek Way
- 1214 Manzano Way
- 1219 Oak Creek Way
- 1216 Manzano Way
- 1270 Prescott Ave
- 1222 Oak Creek Way
- 1264 Prescott Ave
- 1276 Prescott Ave