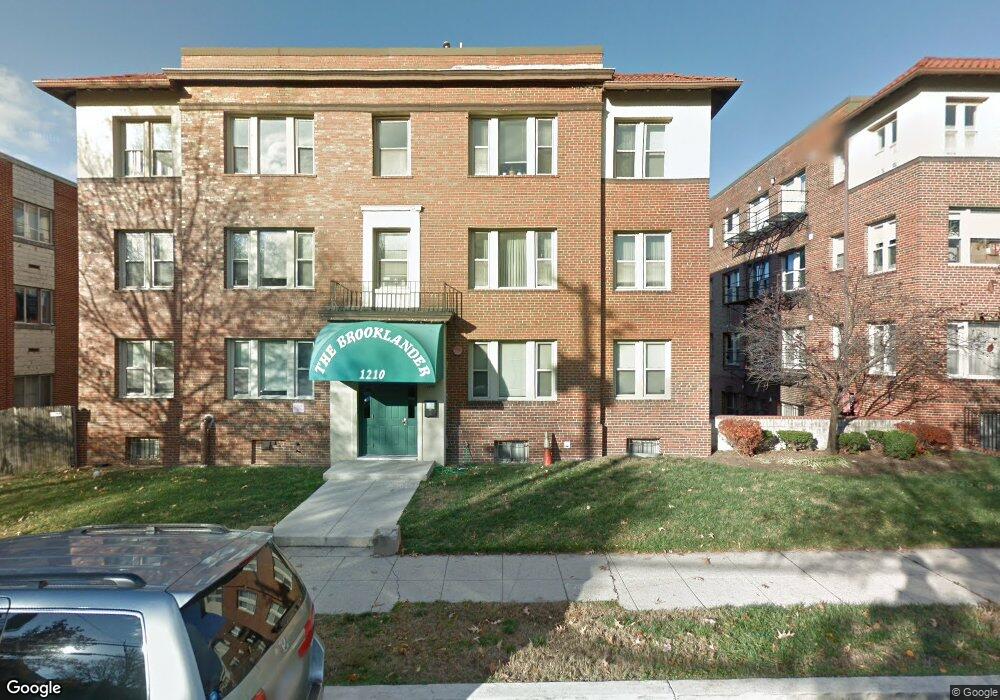
1210 Perry St NE Washington, DC 20017
Brookland NeighborhoodEstimated Value: $391,488 - $448,000
3
Beds
1
Bath
951
Sq Ft
$431/Sq Ft
Est. Value
About This Home
This home is located at 1210 Perry St NE, Washington, DC 20017 and is currently estimated at $410,122, approximately $431 per square foot. 1210 Perry St NE is a home located in District of Columbia with nearby schools including Bunker Hill Elementary School, Brookland Middle School, and Dunbar High School.
Ownership History
Date
Name
Owned For
Owner Type
Purchase Details
Closed on
Nov 11, 2021
Sold by
Levy Spencer and Abi-Rached Dina
Bought by
Levy Spencer and Abi-Rached Dina
Current Estimated Value
Purchase Details
Closed on
Jul 10, 2020
Sold by
Flusche Darren
Bought by
Levy Spencer and Abi-Rached Dina
Home Financials for this Owner
Home Financials are based on the most recent Mortgage that was taken out on this home.
Original Mortgage
$348,000
Outstanding Balance
$308,583
Interest Rate
3.1%
Mortgage Type
New Conventional
Estimated Equity
$101,539
Purchase Details
Closed on
Sep 3, 2014
Sold by
Drayton Iris
Bought by
Flusche Darren
Home Financials for this Owner
Home Financials are based on the most recent Mortgage that was taken out on this home.
Original Mortgage
$301,500
Interest Rate
4.12%
Mortgage Type
New Conventional
Purchase Details
Closed on
May 4, 1998
Sold by
Manna Inc
Bought by
Drayton Iris A
Create a Home Valuation Report for This Property
The Home Valuation Report is an in-depth analysis detailing your home's value as well as a comparison with similar homes in the area
Home Values in the Area
Average Home Value in this Area
Purchase History
| Date | Buyer | Sale Price | Title Company |
|---|---|---|---|
| Levy Spencer | -- | None Available | |
| Levy Spencer | $435,000 | None Available | |
| Flusche Darren | $335,000 | -- | |
| Drayton Iris A | $107,000 | -- |
Source: Public Records
Mortgage History
| Date | Status | Borrower | Loan Amount |
|---|---|---|---|
| Open | Levy Spencer | $348,000 | |
| Previous Owner | Flusche Darren | $301,500 |
Source: Public Records
Tax History Compared to Growth
Tax History
| Year | Tax Paid | Tax Assessment Tax Assessment Total Assessment is a certain percentage of the fair market value that is determined by local assessors to be the total taxable value of land and additions on the property. | Land | Improvement |
|---|---|---|---|---|
| 2024 | $2,607 | $408,890 | $122,670 | $286,220 |
| 2023 | $2,788 | $426,670 | $128,000 | $298,670 |
| 2022 | $2,863 | $429,280 | $128,780 | $300,500 |
| 2021 | $2,627 | $398,660 | $119,600 | $279,060 |
| 2020 | $2,463 | $385,390 | $115,620 | $269,770 |
| 2019 | $2,246 | $371,020 | $111,310 | $259,710 |
| 2018 | $2,055 | $315,060 | $0 | $0 |
| 2017 | $1,922 | $298,530 | $0 | $0 |
| 2016 | $1,816 | $285,290 | $0 | $0 |
| 2015 | $1,420 | $255,010 | $0 | $0 |
| 2014 | -- | $223,310 | $0 | $0 |
Source: Public Records
Map
Nearby Homes
- 1218 Perry St NE Unit 301
- 1210 Perry St NE Unit 201
- 3722 13th St NE
- 1055 Michigan Ave NE Unit 1055
- 1049 Michigan Ave NE Unit 1049
- 1032 Otis St NE Unit G01
- 1312 Randolph St NE
- 1227 Michigan Ave NE
- 1348 Newton St NE
- 913 Quincy St NE Unit 3
- 922 Perry Place NE
- 1358 Newton St NE
- 1234 Monroe St NE
- 1248 Monroe St NE
- 1400 Newton St NE
- 705 Quincy St NE Unit 4
- 705 Quincy St NE Unit 2
- 4109 13th St NE
- 4019 9th St NE Unit 3
- 4200 13th St NE
- 1210 Perry St NE Unit T3
- 1210 Perry St NE
- 1210 Perry St NE
- 1210 Perry St NE
- 1210 Perry St NE
- 1210 Perry St NE Unit 301
- 1210 Perry St NE Unit G1
- 1210 Perry St NE Unit 102
- 1210 Perry St NE Unit T2
- 1210 Perry St NE Unit 203
- 1210 Perry St NE Unit 103
- 1210 Perry St NE Unit 302
- 1210 Perry St NE Unit 101
- 1210 Perry St NE Unit 202
- 1210 Perry St NE Unit 303
- 1200 Perry St NE Unit LOWER LEVEL
- 1200 Perry St NE Unit BASEMENT
- 1200 Perry St NE Unit 100
- 1200 Perry St NE Unit 400
- 1218 Perry St NE Unit 201