

1210 S Q St Richmond, IN 47374
2
Beds
2
Baths
1,280
Sq Ft
22
Acres
Highlights
- Ranch Style House
- Porch
- Bathroom on Main Level
- First Floor Utility Room
- Living Room
- Central Air
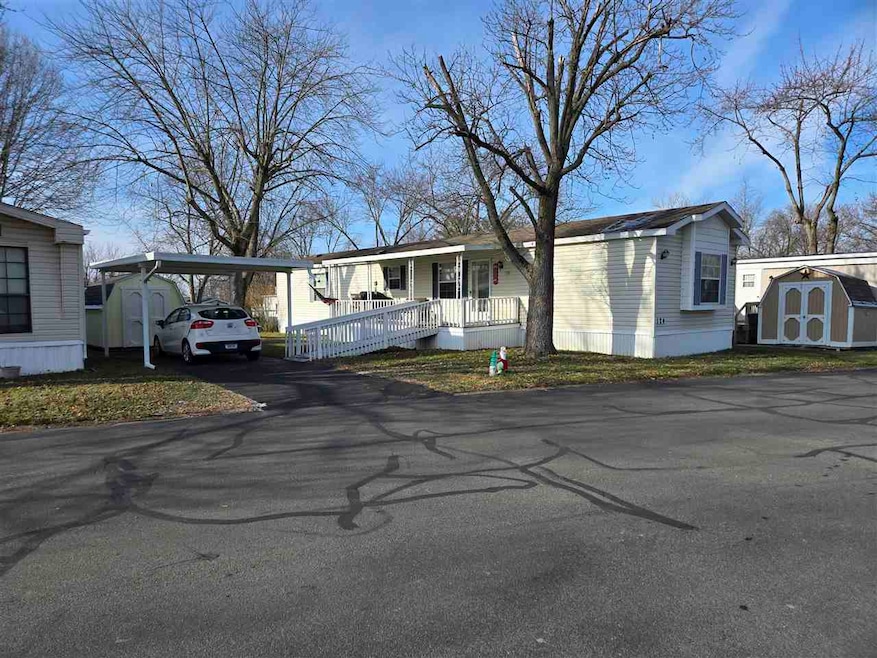
About This Home
As of March 2025Awesome 2 bedroom, 2 bathroom in Leisure Village. It is complete with all appliances including washer and dryer. it has a very nice covered carport, storage shed, handicap ramp and a covered porch. Contact George at 513-886-1949 for your private showing.
Last Agent to Sell the Property
Coldwell Banker Lingle License #RB14042262 Listed on: 12/16/2024
Home Details
Home Type
- Single Family
Est. Annual Taxes
- $31,029
Year Built
- Built in 2004
Home Design
- Ranch Style House
- Asphalt Roof
- Aluminum Siding
- Vinyl Siding
- Modular or Manufactured Materials
- Asphalt
Interior Spaces
- Window Treatments
- Living Room
- Dining Room
- First Floor Utility Room
- Washer and Dryer
Kitchen
- Electric Range
- Microwave
- Dishwasher
Bedrooms and Bathrooms
- 2 Bedrooms
- Bathroom on Main Level
- 2 Full Bathrooms
Schools
- Charles Elementary School
- Test/Dennis Middle School
- Richmond High School
Utilities
- Central Air
- Heating System Uses Gas
- Electric Water Heater
Additional Features
- Porch
- Lot Dimensions are 16x72
Ownership History
Date
Name
Owned For
Owner Type
Purchase Details
Closed on
Dec 16, 2016
Sold by
Fireside Mobile Homes Inc
Bought by
Leisure Village Mhc Llc and Leisure Village Stewart Llc
Purchase Details
Closed on
Jan 30, 2012
Sold by
Ozbun Pamela E
Bought by
Kidder Julia A
Similar Homes in Richmond, IN
Create a Home Valuation Report for This Property
The Home Valuation Report is an in-depth analysis detailing your home's value as well as a comparison with similar homes in the area
Home Values in the Area
Average Home Value in this Area
Purchase History
| Date | Type | Sale Price | Title Company |
|---|---|---|---|
| Deed | -- | None Available | |
| Contract Of Sale | $10,800 | None Available |
Source: Public Records
Mortgage History
| Date | Status | Loan Amount | Loan Type |
|---|---|---|---|
| Open | $2,525,000 | New Conventional | |
| Closed | $0 | Seller Take Back |
Source: Public Records
Property History
| Date | Event | Price | Change | Sq Ft Price |
|---|---|---|---|---|
| 07/24/2025 07/24/25 | Pending | -- | -- | -- |
| 06/03/2025 06/03/25 | Price Changed | $39,000 | +96.0% | $40 / Sq Ft |
| 05/31/2025 05/31/25 | Price Changed | $19,900 | -55.8% | $25 / Sq Ft |
| 05/05/2025 05/05/25 | For Sale | $45,000 | +80.7% | $46 / Sq Ft |
| 04/30/2025 04/30/25 | Price Changed | $24,900 | -28.9% | $32 / Sq Ft |
| 03/19/2025 03/19/25 | Sold | $35,000 | +17.1% | $27 / Sq Ft |
| 03/18/2025 03/18/25 | For Sale | $29,900 | -25.1% | $38 / Sq Ft |
| 03/05/2025 03/05/25 | Pending | -- | -- | -- |
| 12/16/2024 12/16/24 | For Sale | $39,900 | +99.5% | $31 / Sq Ft |
| 08/30/2024 08/30/24 | Sold | $20,000 | -33.3% | $20 / Sq Ft |
| 08/21/2024 08/21/24 | Pending | -- | -- | -- |
| 05/13/2024 05/13/24 | For Sale | $30,000 | -52.0% | $30 / Sq Ft |
| 08/18/2023 08/18/23 | Sold | $62,500 | +228.9% | $56 / Sq Ft |
| 07/28/2023 07/28/23 | Sold | $19,000 | -70.7% | $15 / Sq Ft |
| 07/10/2023 07/10/23 | Pending | -- | -- | -- |
| 06/13/2023 06/13/23 | For Sale | $64,900 | +154.5% | $58 / Sq Ft |
| 05/16/2023 05/16/23 | For Sale | $25,500 | -60.7% | $20 / Sq Ft |
| 05/07/2023 05/07/23 | Pending | -- | -- | -- |
| 04/10/2023 04/10/23 | For Sale | $64,900 | +70.8% | $58 / Sq Ft |
| 10/04/2022 10/04/22 | Sold | $38,000 | -13.6% | $30 / Sq Ft |
| 09/29/2022 09/29/22 | Pending | -- | -- | -- |
| 09/09/2022 09/09/22 | For Sale | $44,000 | +60.0% | $34 / Sq Ft |
| 09/13/2021 09/13/21 | Sold | $27,500 | +10.0% | $21 / Sq Ft |
| 08/23/2021 08/23/21 | Pending | -- | -- | -- |
| 08/13/2021 08/13/21 | For Sale | $25,000 | +53.8% | $20 / Sq Ft |
| 12/01/2020 12/01/20 | Sold | $16,250 | -18.3% | $14 / Sq Ft |
| 11/22/2020 11/22/20 | Pending | -- | -- | -- |
| 10/22/2020 10/22/20 | For Sale | $19,900 | -- | $17 / Sq Ft |
Source: Richmond Association of REALTORS®
Tax History Compared to Growth
Tax History
| Year | Tax Paid | Tax Assessment Tax Assessment Total Assessment is a certain percentage of the fair market value that is determined by local assessors to be the total taxable value of land and additions on the property. | Land | Improvement |
|---|---|---|---|---|
| 2024 | $31,029 | $1,548,100 | $388,700 | $1,159,400 |
| 2023 | $30,962 | $1,548,100 | $388,700 | $1,159,400 |
| 2022 | $27,880 | $1,394,000 | $347,000 | $1,047,000 |
| 2021 | $27,880 | $1,394,000 | $372,500 | $1,021,500 |
| 2020 | $27,880 | $1,394,000 | $372,400 | $1,021,600 |
| 2019 | $27,991 | $1,394,000 | $372,400 | $1,021,600 |
| 2018 | $27,880 | $1,394,000 | $372,400 | $1,021,600 |
| 2017 | $21,209 | $1,060,200 | $195,700 | $864,500 |
| 2016 | $21,129 | $1,056,200 | $194,000 | $862,200 |
| 2014 | $20,742 | $1,037,100 | $194,000 | $843,100 |
| 2013 | $20,742 | $1,017,000 | $194,000 | $823,000 |
Source: Public Records
Agents Affiliated with this Home
-
Rebecca Cate
R
Seller's Agent in 2025
Rebecca Cate
Better Homes and Gardens First Realty Group
(765) 960-5697
108 Total Sales
-
Debbie Rudd
Seller's Agent in 2025
Debbie Rudd
Better Homes and Gardens First Realty Group
(765) 969-6822
325 Total Sales
-
George Marchbanks
Seller's Agent in 2025
George Marchbanks
Coldwell Banker Lingle
(513) 886-1949
135 Total Sales
-
mellisa johnson
Buyer's Agent in 2025
mellisa johnson
RE/MAX At The Crossing
(765) 238-7600
23 Total Sales
-
Jeff Mustard
Seller's Agent in 2024
Jeff Mustard
Coldwell Banker Lingle
(765) 977-6949
24 Total Sales
-
Brad Hobson
Buyer's Agent in 2024
Brad Hobson
Better Homes and Gardens First Realty Group
(765) 993-5752
10 Total Sales
Map
Source: Richmond Association of REALTORS®
MLS Number: 10050079
APN: 89-18-09-130-601.000-030
Nearby Homes