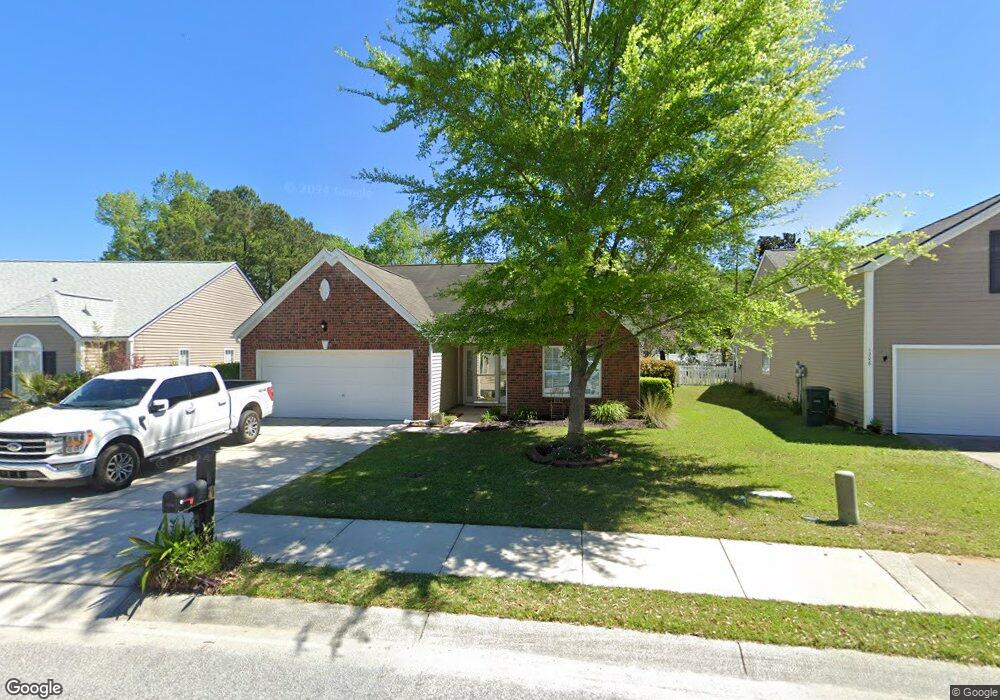
1210 Shadow Mist Ln Charleston, SC 29492
Wando NeighborhoodEstimated Value: $434,000 - $546,000
3
Beds
2
Baths
1,459
Sq Ft
$331/Sq Ft
Est. Value
About This Home
This home is located at 1210 Shadow Mist Ln, Charleston, SC 29492 and is currently estimated at $482,284, approximately $330 per square foot. 1210 Shadow Mist Ln is a home located in Berkeley County.
Ownership History
Date
Name
Owned For
Owner Type
Purchase Details
Closed on
Oct 15, 2012
Sold by
Yoskinski Richard
Bought by
Frank Robert M and Frank Patricia A
Current Estimated Value
Home Financials for this Owner
Home Financials are based on the most recent Mortgage that was taken out on this home.
Original Mortgage
$147,283
Outstanding Balance
$103,134
Interest Rate
3.75%
Mortgage Type
FHA
Estimated Equity
$379,150
Purchase Details
Closed on
Nov 10, 2006
Sold by
Kozy Rachel
Bought by
Yoskinski Richard
Purchase Details
Closed on
Dec 15, 2005
Sold by
Knight Markus M
Bought by
Yosinski Richard and Kozy Rachel
Home Financials for this Owner
Home Financials are based on the most recent Mortgage that was taken out on this home.
Original Mortgage
$191,200
Interest Rate
5.87%
Mortgage Type
Adjustable Rate Mortgage/ARM
Purchase Details
Closed on
May 10, 2005
Sold by
D R Horton Inc
Bought by
Knight Markus M
Home Financials for this Owner
Home Financials are based on the most recent Mortgage that was taken out on this home.
Original Mortgage
$211,490
Interest Rate
5.74%
Mortgage Type
Future Advance Clause Open End Mortgage
Create a Home Valuation Report for This Property
The Home Valuation Report is an in-depth analysis detailing your home's value as well as a comparison with similar homes in the area
Home Values in the Area
Average Home Value in this Area
Purchase History
| Date | Buyer | Sale Price | Title Company |
|---|---|---|---|
| Frank Robert M | $150,000 | -- | |
| Yoskinski Richard | -- | None Available | |
| Yosinski Richard | $239,000 | None Available | |
| Knight Markus M | $220,310 | -- |
Source: Public Records
Mortgage History
| Date | Status | Borrower | Loan Amount |
|---|---|---|---|
| Open | Frank Robert M | $147,283 | |
| Previous Owner | Yosinski Richard | $191,200 | |
| Previous Owner | Knight Markus M | $211,490 |
Source: Public Records
Tax History Compared to Growth
Tax History
| Year | Tax Paid | Tax Assessment Tax Assessment Total Assessment is a certain percentage of the fair market value that is determined by local assessors to be the total taxable value of land and additions on the property. | Land | Improvement |
|---|---|---|---|---|
| 2025 | $1,372 | $201,972 | $52,537 | $149,435 |
| 2024 | $1,372 | $8,078 | $2,101 | $5,977 |
| 2023 | $1,372 | $8,078 | $2,101 | $5,977 |
| 2022 | $1,263 | $7,025 | $1,997 | $5,028 |
| 2021 | $1,285 | $7,030 | $1,997 | $5,028 |
| 2020 | $1,310 | $7,025 | $1,997 | $5,028 |
| 2019 | $1,334 | $7,025 | $1,997 | $5,028 |
| 2018 | $1,169 | $6,109 | $1,573 | $4,536 |
| 2017 | $1,168 | $6,109 | $1,573 | $4,536 |
| 2016 | $1,183 | $6,110 | $1,570 | $4,540 |
| 2015 | $1,109 | $6,110 | $1,570 | $4,540 |
| 2014 | $1,108 | $6,110 | $1,570 | $4,540 |
| 2013 | -- | $6,110 | $1,570 | $4,540 |
Source: Public Records
Map
Nearby Homes
- 1344 Palm Cove Dr
- 1295 Island Club Dr Unit C
- 1316 Island Club Dr Unit A
- 112 Berkshire Dr
- 1436 Water Edge Dr
- 1126 Peninsula Cove Dr
- 213 Ashmont Dr
- 1102 Waters Inlet Cir
- 237 Nelliefield Creek Dr
- 213 Nelliefield Creek Dr
- 308 Tidal Rice Ct
- 117 Wando Reach Rd
- 214 Rice Mill Place
- 133 Wando Reach Rd
- 1157 Oak Bluff Ave
- 1161 Oak Bluff Ave
- 1165 Oak Bluff Ave
- 420 Nelliefield Trail
- 142 Wando Reach Rd
- 141 Wando Reach Rd
- 1212 Shadow Mist Ln
- 1206 Shadow Mist Ln
- 1214 Shadow Mist Ln
- 1122 Ole Oak Dr
- 1211 Shadow Mist Ln
- 1130 Ole Oak Dr
- 1213 Shadow Mist Ln
- 1207 Shadow Mist Ln
- 1222 Shadow Mist Ln
- 1215 Shadow Mist Ln
- 1228 Shadow Mist Ln
- 1110 Ole Oak Dr
- 1219 Shadow Mist Ln
- 1230 Shadow Mist Ln
- 1106 Ole Oak Dr
- 1263 Palm Cove Dr
- 1234 Shadow Mist Ln
- 1267 Palm Cove Dr
- 1221 Shadow Mist Ln
- 1102 Ole Oak Dr