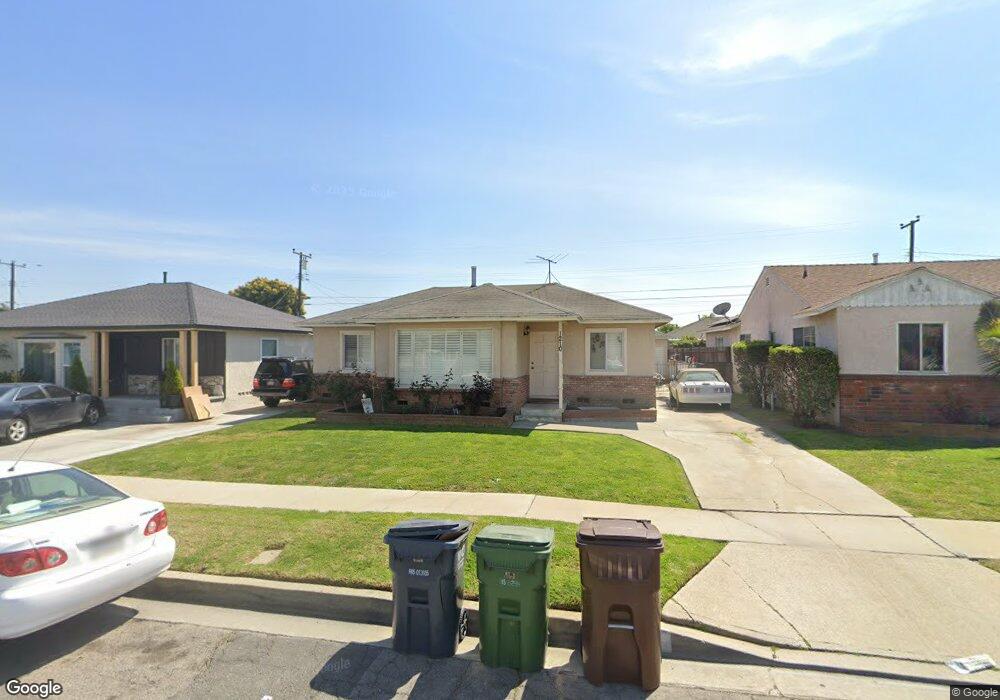
1210 W 137th St Compton, CA 90222
Estimated Value: $703,101 - $787,000
4
Beds
2
Baths
1,648
Sq Ft
$444/Sq Ft
Est. Value
About This Home
This home is located at 1210 W 137th St, Compton, CA 90222 and is currently estimated at $732,525, approximately $444 per square foot. 1210 W 137th St is a home located in Los Angeles County with nearby schools including Ronald E. McNair Elementary School, Enterprise Middle School, and Centennial High School.
Ownership History
Date
Name
Owned For
Owner Type
Purchase Details
Closed on
Jan 8, 2010
Sold by
Ccw Enterprise
Bought by
Ujamaa Mjenzi
Current Estimated Value
Home Financials for this Owner
Home Financials are based on the most recent Mortgage that was taken out on this home.
Original Mortgage
$234,671
Outstanding Balance
$157,100
Interest Rate
5.5%
Mortgage Type
FHA
Estimated Equity
$575,425
Purchase Details
Closed on
Jun 29, 2009
Sold by
Perkins Joyce A and Willie V Williams Separate Pro
Bought by
Ccw Enterprise
Home Financials for this Owner
Home Financials are based on the most recent Mortgage that was taken out on this home.
Original Mortgage
$100,000
Interest Rate
5.3%
Mortgage Type
Purchase Money Mortgage
Purchase Details
Closed on
Jan 16, 2004
Sold by
Williams Willie V
Bought by
Williams Willie and The Willie V Williams Separate Property
Create a Home Valuation Report for This Property
The Home Valuation Report is an in-depth analysis detailing your home's value as well as a comparison with similar homes in the area
Home Values in the Area
Average Home Value in this Area
Purchase History
| Date | Buyer | Sale Price | Title Company |
|---|---|---|---|
| Ujamaa Mjenzi | $239,000 | Stewart Title Company | |
| Ccw Enterprise | $100,000 | Fatcola | |
| Williams Willie | -- | -- |
Source: Public Records
Mortgage History
| Date | Status | Borrower | Loan Amount |
|---|---|---|---|
| Open | Ujamaa Mjenzi | $234,671 | |
| Previous Owner | Ccw Enterprise | $100,000 |
Source: Public Records
Tax History
| Year | Tax Paid | Tax Assessment Tax Assessment Total Assessment is a certain percentage of the fair market value that is determined by local assessors to be the total taxable value of land and additions on the property. | Land | Improvement |
|---|---|---|---|---|
| 2025 | $5,775 | $308,490 | $96,417 | $212,073 |
| 2024 | $5,775 | $302,442 | $94,527 | $207,915 |
| 2023 | $5,696 | $296,513 | $92,674 | $203,839 |
| 2022 | $5,063 | $290,700 | $90,857 | $199,843 |
| 2021 | $5,106 | $285,001 | $89,076 | $195,925 |
| 2019 | $4,958 | $276,550 | $86,435 | $190,115 |
| 2018 | $4,802 | $271,129 | $84,741 | $186,388 |
| 2016 | $4,562 | $260,602 | $81,451 | $179,151 |
| 2015 | $4,360 | $256,688 | $80,228 | $176,460 |
| 2014 | $4,279 | $251,661 | $78,657 | $173,004 |
Source: Public Records
Map
Nearby Homes
- 1201 W 138th St
- 1209 W 136th St
- 9607 S Evers Ave
- 1036 W Stockwell St
- 1406 W Stockwell St
- 1410 W Stockwell St
- 14003 S Nestor Ave
- 14016 S Albertson Ave
- 1418 W 134th St
- 1619 W 136th St
- 1716 N Grandee Ave
- 810 W 133rd St
- 0 W 134th Place
- 14118 S Zamora Ave
- 800 N Kalsman Ave
- 1918 W Piru St
- 813 W Stockwell St
- 803 N Grandee Ave
- 1805 N Central Ave
- 850 W 132nd St
- 1214 W 137th St
- 1206 W 137th St
- 1218 W 137th St
- 1211 W 138th St
- 1200 W 137th St
- 1205 W 138th St
- 1215 W 138th St
- 1219 W 138th St
- 1222 W 137th St
- 1209 W 137th St
- 1205 W 137th St
- 1213 W 137th St
- 1203 W 137th St
- 1221 W 138th St
- 1117 W 137th St
- 1217 W 137th St
- 1302 W 137th St
- 1114 W 137th St
- 1301 W 138th St
- 1221 W 137th St
Your Personal Tour Guide
Ask me questions while you tour the home.