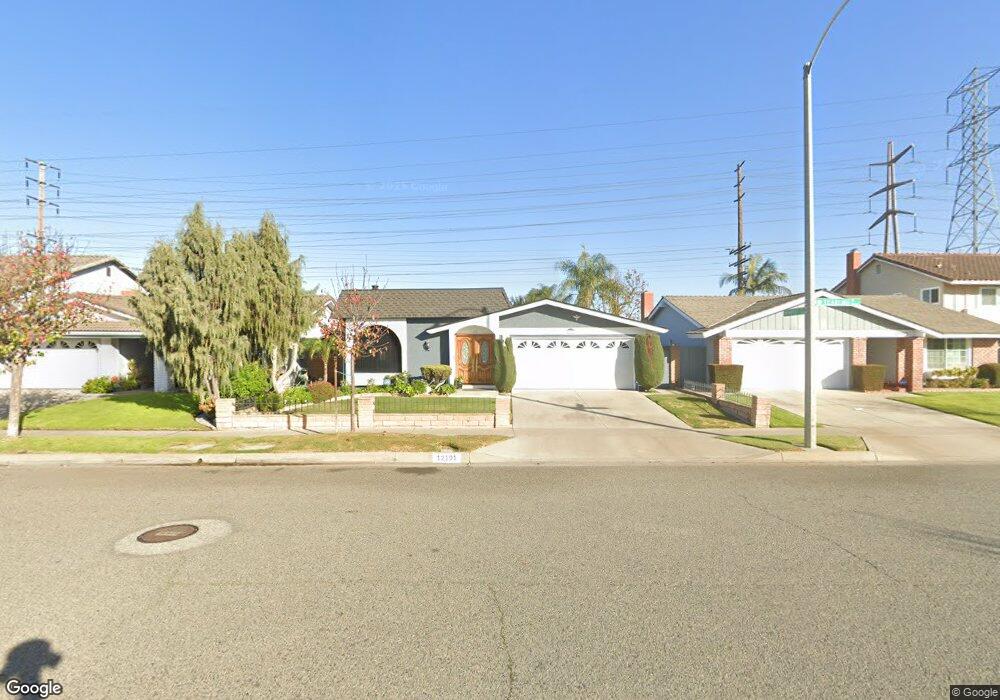
12101 Yearling St Cerritos, CA 90703
Estimated Value: $1,000,000 - $1,090,000
3
Beds
2
Baths
1,557
Sq Ft
$672/Sq Ft
Est. Value
About This Home
This home is located at 12101 Yearling St, Cerritos, CA 90703 and is currently estimated at $1,046,991, approximately $672 per square foot. 12101 Yearling St is a home located in Los Angeles County with nearby schools including Nixon Academy, Haskell Stem Academy, and Artesia High School.
Ownership History
Date
Name
Owned For
Owner Type
Purchase Details
Closed on
Jul 1, 2013
Sold by
Prajuabsook Benjawan
Bought by
Prajuabsook Benjawan and Prajuabsook Chaiyun
Current Estimated Value
Home Financials for this Owner
Home Financials are based on the most recent Mortgage that was taken out on this home.
Original Mortgage
$180,000
Interest Rate
3.79%
Mortgage Type
New Conventional
Purchase Details
Closed on
May 2, 1995
Sold by
Brooks Michael W and Brooks Karen E
Bought by
Prajuabsook Chaiyun
Home Financials for this Owner
Home Financials are based on the most recent Mortgage that was taken out on this home.
Original Mortgage
$175,500
Interest Rate
8.32%
Purchase Details
Closed on
Mar 27, 1995
Sold by
Brooksamerica Mtg Corp
Bought by
Brooks Michael W
Home Financials for this Owner
Home Financials are based on the most recent Mortgage that was taken out on this home.
Original Mortgage
$175,500
Interest Rate
8.32%
Purchase Details
Closed on
Aug 10, 1994
Sold by
Hawkins Marlon and Hawkins Mona
Bought by
Brooksamerica Mtg Corp
Create a Home Valuation Report for This Property
The Home Valuation Report is an in-depth analysis detailing your home's value as well as a comparison with similar homes in the area
Home Values in the Area
Average Home Value in this Area
Purchase History
| Date | Buyer | Sale Price | Title Company |
|---|---|---|---|
| Prajuabsook Benjawan | -- | Wfg | |
| Prajuabsook Chaiyun | $195,000 | Gateway Title | |
| Brooks Michael W | -- | -- | |
| Brooksamerica Mtg Corp | $195,000 | -- |
Source: Public Records
Mortgage History
| Date | Status | Borrower | Loan Amount |
|---|---|---|---|
| Closed | Prajuabsook Benjawan | $180,000 | |
| Closed | Prajuabsook Chaiyun | $175,500 |
Source: Public Records
Tax History
| Year | Tax Paid | Tax Assessment Tax Assessment Total Assessment is a certain percentage of the fair market value that is determined by local assessors to be the total taxable value of land and additions on the property. | Land | Improvement |
|---|---|---|---|---|
| 2025 | $4,104 | $327,511 | $190,799 | $136,712 |
| 2024 | $4,104 | $321,090 | $187,058 | $134,032 |
| 2023 | $3,975 | $314,795 | $183,391 | $131,404 |
| 2022 | $3,913 | $308,624 | $179,796 | $128,828 |
| 2021 | $3,819 | $302,573 | $176,271 | $126,302 |
| 2019 | $3,730 | $293,600 | $171,044 | $122,556 |
| 2018 | $3,416 | $287,844 | $167,691 | $120,153 |
| 2016 | $3,268 | $276,669 | $161,180 | $115,489 |
| 2015 | $3,226 | $272,514 | $158,759 | $113,755 |
| 2014 | $3,167 | $267,177 | $155,650 | $111,527 |
Source: Public Records
Map
Nearby Homes
- 12036 Wendy St
- 11975 Gonsalves St
- 19435 Almadin Ave
- 12143 Phoenix Dr
- 12130 Smokie Ln
- 19922 Rainbow Way
- 19521 Rainbow Ct
- 12022 207th St
- 19140 Albert Ave
- 20603 Seine Ave
- 19705 Teresa Ct
- 20020 Alburtis Ave
- 11702 Christy St
- 20807 Elaine Ave Unit 4
- 20823 Norwalk Blvd Unit 26
- 20802 Ely Ave
- 20802 Pioneer Blvd
- 20223 Jersey Ave
- 12141 Centralia St Unit 206
- 12141 Centralia St Unit 111
- 12105 Yearling St
- 12057 Yearling St
- 12111 Yearling St
- 12053 Yearling St
- 12117 Yearling St
- 12047 Yearling St
- 19902 Horst Ave
- 19903 Horst Ave
- 12121 Yearling St
- 12043 Yearling St
- 19908 Horst Ave
- 19903 Ibex Ave
- 19909 Horst Ave
- 19902 Grayland Ave
- 12125 Yearling St
- 12037 Yearling St
- 19909 Ibex Ave
- 19914 Horst Ave
- 19915 Horst Ave
- 12062 Bertha St
Your Personal Tour Guide
Ask me questions while you tour the home.