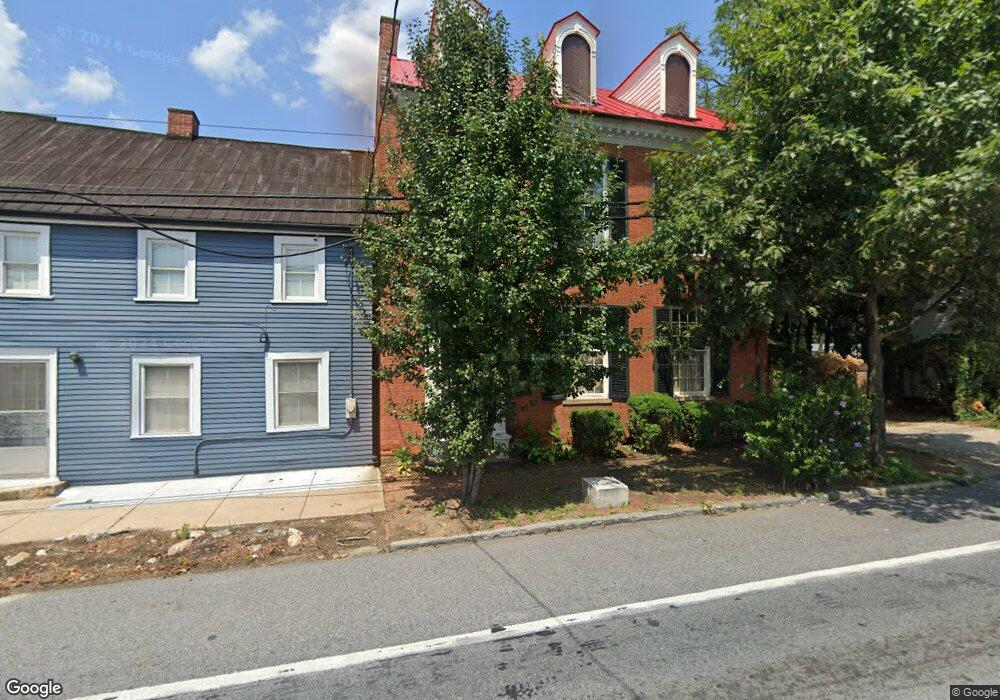
12106 Main St Union Bridge, MD 21791
Estimated Value: $484,000 - $684,000
--
Bed
1
Bath
3,256
Sq Ft
$168/Sq Ft
Est. Value
About This Home
This home is located at 12106 Main St, Union Bridge, MD 21791 and is currently estimated at $545,671, approximately $167 per square foot. 12106 Main St is a home located in Frederick County with nearby schools including Liberty Elementary School, New Market Middle School, and Linganore High School.
Ownership History
Date
Name
Owned For
Owner Type
Purchase Details
Closed on
Apr 21, 2023
Sold by
Cooper Noah
Bought by
Mechler Daniel J and Mcneilly Meghan E
Current Estimated Value
Home Financials for this Owner
Home Financials are based on the most recent Mortgage that was taken out on this home.
Original Mortgage
$378,000
Outstanding Balance
$367,742
Interest Rate
6.73%
Mortgage Type
New Conventional
Estimated Equity
$177,929
Purchase Details
Closed on
Nov 20, 2017
Sold by
Zaal Kristina Johanna Maria and Dijkstra Jan
Bought by
Cooper Noah and Cooper Sarah
Home Financials for this Owner
Home Financials are based on the most recent Mortgage that was taken out on this home.
Original Mortgage
$398,100
Interest Rate
4.37%
Mortgage Type
FHA
Purchase Details
Closed on
Dec 21, 1995
Sold by
Springer Carol G
Bought by
Dijkstra Jan and Zaal Kristina
Create a Home Valuation Report for This Property
The Home Valuation Report is an in-depth analysis detailing your home's value as well as a comparison with similar homes in the area
Home Values in the Area
Average Home Value in this Area
Purchase History
| Date | Buyer | Sale Price | Title Company |
|---|---|---|---|
| Mechler Daniel J | $420,000 | Old Republic National Title | |
| Cooper Noah | $375,000 | Title Forward | |
| Dijkstra Jan | $230,000 | -- |
Source: Public Records
Mortgage History
| Date | Status | Borrower | Loan Amount |
|---|---|---|---|
| Open | Mechler Daniel J | $378,000 | |
| Previous Owner | Cooper Noah | $398,100 | |
| Closed | Dijkstra Jan | -- |
Source: Public Records
Tax History Compared to Growth
Tax History
| Year | Tax Paid | Tax Assessment Tax Assessment Total Assessment is a certain percentage of the fair market value that is determined by local assessors to be the total taxable value of land and additions on the property. | Land | Improvement |
|---|---|---|---|---|
| 2025 | $5,394 | $497,100 | $127,900 | $369,200 |
| 2024 | $5,394 | $453,833 | $0 | $0 |
| 2023 | $4,897 | $410,567 | $0 | $0 |
| 2022 | $4,390 | $367,300 | $85,400 | $281,900 |
| 2021 | $4,229 | $360,400 | $0 | $0 |
| 2020 | $4,229 | $353,500 | $0 | $0 |
| 2019 | $4,158 | $346,600 | $81,400 | $265,200 |
| 2018 | $4,165 | $344,067 | $0 | $0 |
| 2017 | $4,099 | $346,600 | $0 | $0 |
| 2016 | $3,884 | $339,000 | $0 | $0 |
| 2015 | $3,884 | $333,400 | $0 | $0 |
| 2014 | $3,884 | $327,800 | $0 | $0 |
Source: Public Records
Map
Nearby Homes
- 12109 Liberty Rd
- 12061 & 12059 Main St
- 11940 Main St
- 9130 Liberty Village Way
- 11911 Main St
- 9522 Bessie Clemson Rd
- 10027 Pine Tree Rd
- 11035 Bennie Duncan Rd
- 9505 Cabbage Run Rd
- 0 Keys Chapel Rd Unit MDFR2040360
- 13715 New Windsor Rd
- 11023 Horseshoe Dr
- 7192 Rosalees Way
- 7192 Rosalees Walk
- 10242 Daysville Rd
- 10236 Daysville Rd
- 0 Muth Rd
- 10543 Woodsboro Rd
- 8245 Water Street Rd
- 8008 Dustin Dr
- 12106 Main St
- 12114 Liberty Rd
- 12102 Main St
- 12110 Main St
- 12301 Green Valley Rd
- 12105 Main St
- 123125 Church St W
- 12101 Main St
- 12070 Liberty Rd
- 12070 Main St
- 12066 Liberty Rd
- 12067 Main St
- 12068 Liberty Rd
- 9138 Walnut St
- 12067 Liberty Rd
- 12114 Main St
- 12109 Main St
- 12114 Main St
- 12063 Main St
- 12063 Main St