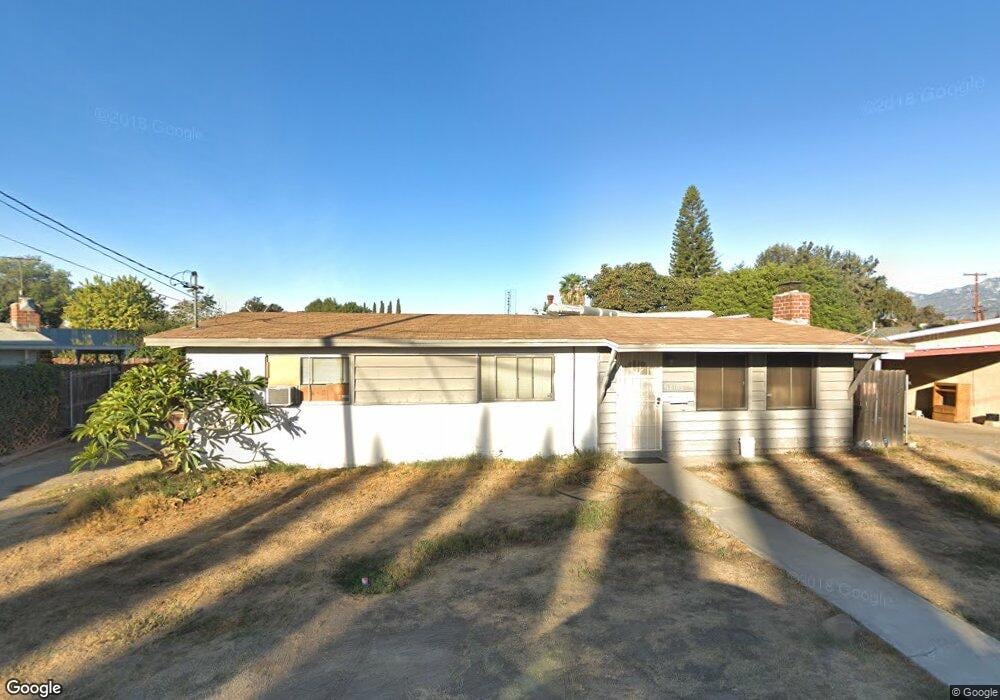
12106 Ranchito St El Monte, CA 91732
Norwood Cherrylee NeighborhoodEstimated Value: $718,000 - $770,000
3
Beds
2
Baths
1,149
Sq Ft
$652/Sq Ft
Est. Value
About This Home
This home is located at 12106 Ranchito St, El Monte, CA 91732 and is currently estimated at $749,667, approximately $652 per square foot. 12106 Ranchito St is a home located in Los Angeles County with nearby schools including Durfee School and Arroyo High School.
Ownership History
Date
Name
Owned For
Owner Type
Purchase Details
Closed on
Mar 23, 2001
Sold by
Hud
Bought by
Dong Chang Bin
Current Estimated Value
Home Financials for this Owner
Home Financials are based on the most recent Mortgage that was taken out on this home.
Original Mortgage
$107,110
Interest Rate
7.14%
Purchase Details
Closed on
Jun 2, 2000
Sold by
Homeside Lending Inc
Bought by
Hud
Purchase Details
Closed on
Apr 25, 2000
Sold by
Morales Manuel and Bello Celia
Bought by
Homeside Lending Inc
Purchase Details
Closed on
Apr 22, 1996
Sold by
Armstrong Vicki Sue and The Armstrong Revocable Trust
Bought by
Morales Manuel and Bello Celia
Home Financials for this Owner
Home Financials are based on the most recent Mortgage that was taken out on this home.
Original Mortgage
$123,057
Interest Rate
8.25%
Mortgage Type
FHA
Create a Home Valuation Report for This Property
The Home Valuation Report is an in-depth analysis detailing your home's value as well as a comparison with similar homes in the area
Home Values in the Area
Average Home Value in this Area
Purchase History
| Date | Buyer | Sale Price | Title Company |
|---|---|---|---|
| Dong Chang Bin | $134,000 | Investors Title | |
| Hud | $138,192 | Fidelity National Title | |
| Homeside Lending Inc | $138,192 | Fidelity National Title Ins | |
| Morales Manuel | $124,000 | Old Republic Title Company |
Source: Public Records
Mortgage History
| Date | Status | Borrower | Loan Amount |
|---|---|---|---|
| Previous Owner | Dong Chang Bin | $107,110 | |
| Previous Owner | Morales Manuel | $123,057 |
Source: Public Records
Tax History
| Year | Tax Paid | Tax Assessment Tax Assessment Total Assessment is a certain percentage of the fair market value that is determined by local assessors to be the total taxable value of land and additions on the property. | Land | Improvement |
|---|---|---|---|---|
| 2025 | $3,116 | $201,739 | $161,371 | $40,368 |
| 2024 | $3,116 | $197,784 | $158,207 | $39,577 |
| 2023 | $3,055 | $193,906 | $155,105 | $38,801 |
| 2022 | $2,949 | $190,105 | $152,064 | $38,041 |
| 2021 | $2,977 | $186,379 | $149,083 | $37,296 |
| 2019 | $3,029 | $180,853 | $144,662 | $36,191 |
| 2018 | $2,927 | $177,308 | $141,826 | $35,482 |
| 2016 | $2,806 | $170,425 | $136,320 | $34,105 |
| 2015 | $2,774 | $167,866 | $134,273 | $33,593 |
| 2014 | $2,677 | $164,578 | $131,643 | $32,935 |
Source: Public Records
Map
Nearby Homes
- 4724 Durfee Ave
- 12118 Killian St
- 4420 Maxson Rd
- 4404 Cogswell Rd
- 4731 Helmgate Dr
- 11917 Roseglen St
- 11734 Lower Azusa Rd
- 4229 Cogswell Rd
- 11654 Roseglen St
- 11825 Basye St
- 12141 Ramona Blvd
- 11834 Kerrwood St
- 11639 Hallwood Dr
- 4042 Maxson Rd Unit C
- 12066 Celine St
- 4849 Peck Rd Unit 67
- 4849 Peck Rd Unit 48
- 4849 Peck Rd Unit 37
- 4849 Peck Rd Unit 36
- 4849 Peck Rd Unit 13
- 12108 Ranchito St
- 12104 Ranchito St
- 12114 Ranchito St
- 12112 Ranchito St
- 12056 Ranchito St
- 12116 Ranchito St
- 12102 Ranchito St
- 12048 Ranchito St
- 12128 Ranchito St
- 12118 Ranchito St
- 12046 Ranchito St
- 12130 Ranchito St
- 12044 Ranchito St
- 12121 Emery St
- 12050 Ranchito St
- 12120 Ranchito St
- 12126 Ranchito St
- 12105 Emery St
- 12123 Emery St
- 12115 Emery St
Your Personal Tour Guide
Ask me questions while you tour the home.