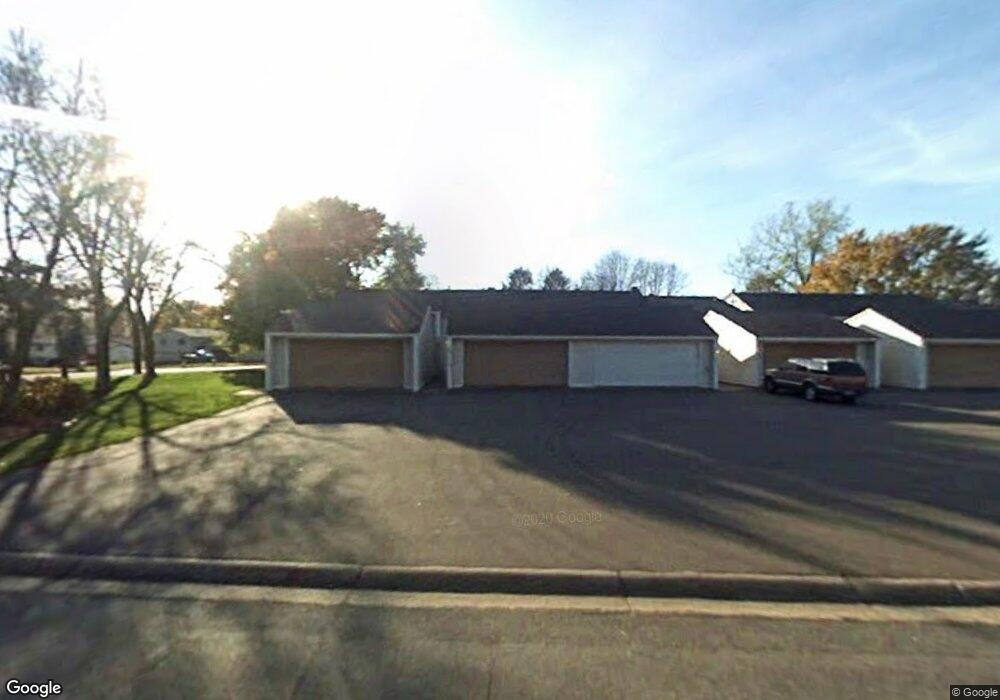
12108 Drake St NW Coon Rapids, MN 55448
Estimated Value: $240,000 - $285,000
3
Beds
2
Baths
1,440
Sq Ft
$177/Sq Ft
Est. Value
About This Home
This home is located at 12108 Drake St NW, Coon Rapids, MN 55448 and is currently estimated at $255,274, approximately $177 per square foot. 12108 Drake St NW is a home located in Anoka County with nearby schools including Lucile Bruner Elementary School, Sand Creek Elementary School, and Laughlin Junior/Senior High School.
Ownership History
Date
Name
Owned For
Owner Type
Purchase Details
Closed on
Feb 28, 2022
Sold by
Thomas Kent and Thomas Christina
Bought by
Jean Roosevelt and Alexis Malange
Current Estimated Value
Home Financials for this Owner
Home Financials are based on the most recent Mortgage that was taken out on this home.
Original Mortgage
$215,031
Outstanding Balance
$200,052
Interest Rate
3.55%
Mortgage Type
New Conventional
Estimated Equity
$55,222
Purchase Details
Closed on
Jun 23, 2021
Sold by
Thomas Kent B and Riverview Third Association
Bought by
Creative Real Estate Inc
Purchase Details
Closed on
Nov 15, 2018
Sold by
Thomas Kent B and Norwest Mortgage Inc
Bought by
Roxsolid Homes Llc
Purchase Details
Closed on
Oct 27, 1998
Sold by
Svobodny Sherri
Bought by
Thomas Kent B
Purchase Details
Closed on
Jul 19, 1994
Sold by
Shook Julie and Fitzsimonds Donald F
Bought by
Svobodny Sherri
Create a Home Valuation Report for This Property
The Home Valuation Report is an in-depth analysis detailing your home's value as well as a comparison with similar homes in the area
Home Values in the Area
Average Home Value in this Area
Purchase History
| Date | Buyer | Sale Price | Title Company |
|---|---|---|---|
| Jean Roosevelt | $230,000 | -- | |
| Creative Real Estate Inc | $5,370 | None Available | |
| Roxsolid Homes Llc | $58,374 | None Available | |
| Thomas Kent B | $79,900 | -- | |
| Svobodny Sherri | $2,000 | -- |
Source: Public Records
Mortgage History
| Date | Status | Borrower | Loan Amount |
|---|---|---|---|
| Open | Jean Roosevelt | $215,031 |
Source: Public Records
Tax History Compared to Growth
Tax History
| Year | Tax Paid | Tax Assessment Tax Assessment Total Assessment is a certain percentage of the fair market value that is determined by local assessors to be the total taxable value of land and additions on the property. | Land | Improvement |
|---|---|---|---|---|
| 2025 | $2,118 | $217,300 | $40,000 | $177,300 |
| 2024 | $2,118 | $216,200 | $40,000 | $176,200 |
| 2023 | $1,844 | $211,800 | $40,000 | $171,800 |
| 2022 | $2,263 | $199,700 | $35,000 | $164,700 |
| 2021 | $2,003 | $164,200 | $38,000 | $126,200 |
| 2020 | $1,781 | $164,700 | $25,000 | $139,700 |
| 2019 | $2,100 | $144,800 | $25,000 | $119,800 |
| 2018 | $2,040 | $131,400 | $0 | $0 |
| 2017 | $1,751 | $126,800 | $0 | $0 |
| 2016 | $1,660 | $99,300 | $0 | $0 |
| 2015 | -- | $99,300 | $16,200 | $83,100 |
| 2014 | -- | $81,400 | $6,000 | $75,400 |
Source: Public Records
Map
Nearby Homes
- 12010 Eagle St NW
- 1449 119th Ln NW
- 1727 121st Ln NW
- 12463 Drake St NW
- 11852 Yellow Pine St NW
- 1625 124th Ave NW
- 11923 Wintergreen St NW
- 12365 Jay St NW
- 1660 Northdale Blvd NW
- 1450 126th Ln NW
- 1593 126th Ln NW
- 12488 Unity St NW
- 12554 Grouse St NW
- 899 123rd Ln NW
- 12796 Bluebird St NW
- 2068 124th Ln NW
- 1234 128th Cir NW
- 1520 129th Ave NW
- 1930 127th Cir NW
- 633 Sand Creek Dr NW
- 12110 Drake St NW
- 12106 Drake St NW
- 12112 Drake St NW
- 12114 Drake St NW
- 12116 Drake St NW
- 12118 Drake St NW
- 1505 121st Ave NW
- 1501 121st Ave NW
- 1513 121st Ave NW
- 1517 121st Ave NW
- 1509 121st Ave NW
- 12128 Drake St NW
- 1521 121st Ave NW
- 12130 Drake St NW
- 1456 121st Ave NW
- 12132 Drake St NW
- 12105 Drake St NW
- 12134 Drake St NW
- 1525 121st Ave NW
- 12090 Drake St NW