1210C Benna Dr Unit MB Myrtle Beach, SC 29577
Downtown Myrtle Beach NeighborhoodEstimated Value: $120,000 - $156,000
1
Bed
1
Bath
780
Sq Ft
$173/Sq Ft
Est. Value
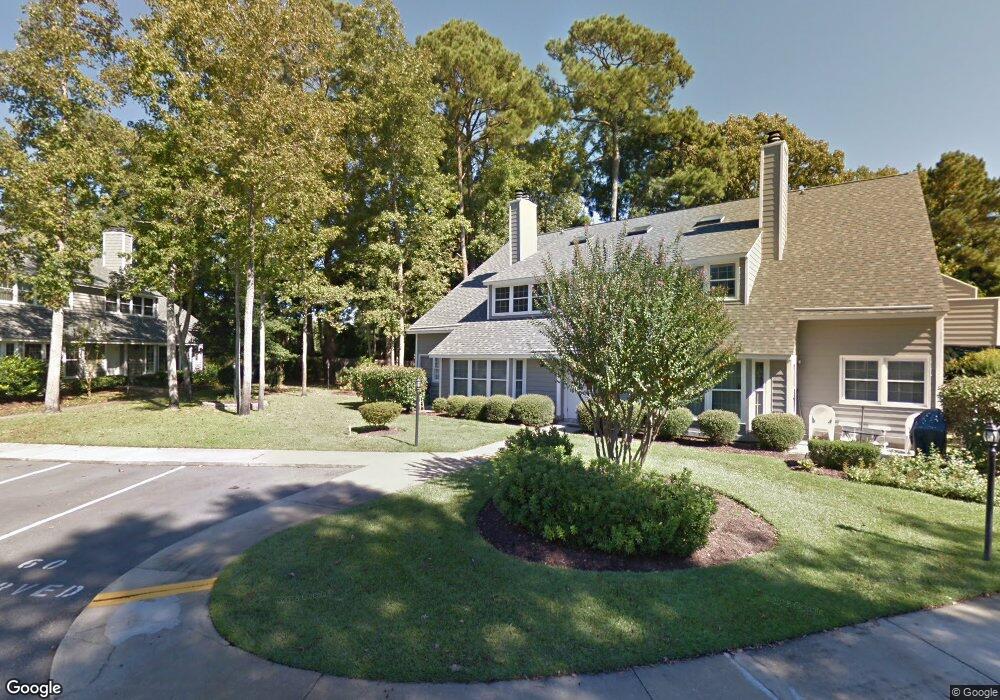
About This Home
This home is located at 1210C Benna Dr Unit MB, Myrtle Beach, SC 29577 and is currently estimated at $134,856, approximately $172 per square foot. 1210C Benna Dr Unit MB is a home located in Horry County with nearby schools including Myrtle Beach Child Development Center, Myrtle Beach Primary School, and Myrtle Beach Elementary School.
Ownership History
Date
Name
Owned For
Owner Type
Purchase Details
Closed on
Feb 21, 2017
Sold by
Easterday Clifford C and Easterday Nora A
Bought by
Whitney William L
Current Estimated Value
Purchase Details
Closed on
Dec 22, 2014
Sold by
Cohen Tanya Marie
Bought by
Easterday Clifford C and Easterday Nora A
Purchase Details
Closed on
Jan 25, 2013
Sold by
Us Bank Trust Co
Bought by
Cohen Tanya Marie
Purchase Details
Closed on
Sep 14, 2012
Sold by
Master In Equity Horry County
Bought by
Us Bank Trust Co
Purchase Details
Closed on
Jun 4, 2009
Sold by
Bridge Margaret J
Bought by
Bridge Ian R
Purchase Details
Closed on
Jul 29, 2005
Sold by
Kean Ann M
Bought by
Bridge Ian R and Bridge Margaret J
Home Financials for this Owner
Home Financials are based on the most recent Mortgage that was taken out on this home.
Original Mortgage
$10,000
Interest Rate
5.48%
Mortgage Type
Stand Alone Second
Create a Home Valuation Report for This Property
The Home Valuation Report is an in-depth analysis detailing your home's value as well as a comparison with similar homes in the area
Home Values in the Area
Average Home Value in this Area
Purchase History
| Date | Buyer | Sale Price | Title Company |
|---|---|---|---|
| Whitney William L | $57,000 | None Available | |
| Easterday Clifford C | $40,000 | -- | |
| Cohen Tanya Marie | $35,000 | -- | |
| Us Bank Trust Co | -- | -- | |
| Bridge Ian R | $4,189 | -- | |
| Bridge Ian R | $65,000 | -- |
Source: Public Records
Mortgage History
| Date | Status | Borrower | Loan Amount |
|---|---|---|---|
| Previous Owner | Bridge Ian R | $10,000 | |
| Previous Owner | Bridge Ian R | $51,750 |
Source: Public Records
Tax History Compared to Growth
Tax History
| Year | Tax Paid | Tax Assessment Tax Assessment Total Assessment is a certain percentage of the fair market value that is determined by local assessors to be the total taxable value of land and additions on the property. | Land | Improvement |
|---|---|---|---|---|
| 2024 | $1,108 | $8,700 | $0 | $8,700 |
| 2023 | $1,108 | $6,615 | $0 | $6,615 |
| 2021 | $1,021 | $6,615 | $0 | $6,615 |
| 2020 | $974 | $6,615 | $0 | $6,615 |
| 2019 | $974 | $6,615 | $0 | $6,615 |
| 2018 | $0 | $5,775 | $0 | $5,775 |
| 2017 | $107 | $2,100 | $0 | $2,100 |
| 2016 | $0 | $3,675 | $0 | $3,675 |
| 2015 | -- | $1,400 | $0 | $1,400 |
| 2014 | $95 | $1,400 | $0 | $1,400 |
Source: Public Records
Map
Nearby Homes
- 1210 Benna Dr Unit B
- 1206 Benna Dr Unit 4-F
- 1200 Benna Dr Unit 1-C
- 1206 Tiffany Ln Unit C
- 1205 Erin Way Unit B
- 1206 Erin Way Unit C
- 1206 Erin Way Unit A
- 1202 Tiffany Ln Unit D
- 1201 Tiffany Ln Unit H
- 703 Beach Walk Place Unit 703
- 1007 Scott Dr
- 804 Moen Place Unit F
- 804 Moen Place Unit A
- 801 Talbot Cir
- 815 Rogers Dr Unit MB
- 633 11th Ave S
- 804 Brenda Place
- 1301 Pridgen Rd Unit 308
- 1301 Pridgen Rd Unit 105
- 1301 Pridgen Rd Unit 1102
- 1210 Benna Dr Unit 1210 C Benna Drive
- 1210 Benna Dr
- 1210 Benna Dr Unit C Sterling Vi
- 1210 Benna Dr Unit 1210G
- 1210 Benna Dr Unit D
- 1210 Benna Dr Unit A
- 1210 Benna Dr Unit 6-F
- 1210 Benna Dr Unit C
- 1210C Benna Dr Unit C
- 1210 Benna Dr Unit 6-F
- 1210 Benna Dr Unit F
- 1210 Benna Dr Unit G
- 1210 Benna Dr Unit B
- 1210 Benna Dr Unit 6-A
- 1208 Benna Dr Unit 5G
- 1208 Benna Dr Unit F - Sterling Village
- 1208 Benna Dr Unit G Sterling Vi
- 1208 Benna Dr
- 1208 Benna Dr Unit F
- 1208 Benna Dr Unit F