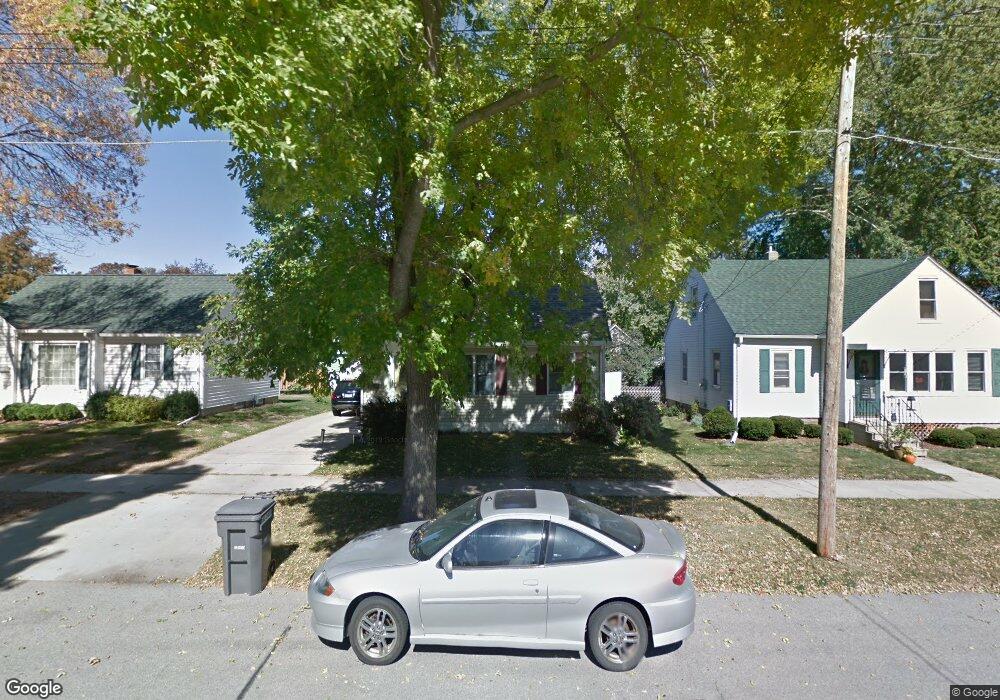
1211 1211 3rd-Street-ne Rochester, MN 55906
Eastside NeighborhoodEstimated Value: $211,000 - $239,156
2
Beds
1
Bath
2,016
Sq Ft
$113/Sq Ft
Est. Value
About This Home
This home is located at 1211 1211 3rd-Street-ne, Rochester, MN 55906 and is currently estimated at $228,289, approximately $113 per square foot. 1211 1211 3rd-Street-ne is a home located in Olmsted County with nearby schools including Jefferson Elementary School, Kellogg Middle School, and Century Senior High School.
Ownership History
Date
Name
Owned For
Owner Type
Purchase Details
Closed on
Nov 14, 2024
Sold by
Chopp Shama Lynette and Wheeler Jesse Ryan
Bought by
Chopp Shama Lynette and Wheeler Jesse Ryan
Current Estimated Value
Purchase Details
Closed on
Apr 29, 2013
Sold by
Zomok Daniel and Zomok Catherine D
Bought by
Chopp Shama
Home Financials for this Owner
Home Financials are based on the most recent Mortgage that was taken out on this home.
Original Mortgage
$119,790
Interest Rate
3.25%
Mortgage Type
FHA
Purchase Details
Closed on
May 30, 2008
Sold by
Halling Christopher J and Halling Becky J
Bought by
Zomok Daniel and Zomok Catherine D
Home Financials for this Owner
Home Financials are based on the most recent Mortgage that was taken out on this home.
Original Mortgage
$119,059
Interest Rate
6.05%
Mortgage Type
FHA
Create a Home Valuation Report for This Property
The Home Valuation Report is an in-depth analysis detailing your home's value as well as a comparison with similar homes in the area
Home Values in the Area
Average Home Value in this Area
Purchase History
| Date | Buyer | Sale Price | Title Company |
|---|---|---|---|
| Chopp Shama Lynette | $500 | Rochester Title | |
| Chopp Shama | $122,000 | Rochester Title | |
| Zomok Daniel | $120,000 | Holt Title Guaranty Co Inc |
Source: Public Records
Mortgage History
| Date | Status | Borrower | Loan Amount |
|---|---|---|---|
| Previous Owner | Chopp Shama | $119,790 | |
| Previous Owner | Zomok Daniel | $119,059 |
Source: Public Records
Tax History Compared to Growth
Tax History
| Year | Tax Paid | Tax Assessment Tax Assessment Total Assessment is a certain percentage of the fair market value that is determined by local assessors to be the total taxable value of land and additions on the property. | Land | Improvement |
|---|---|---|---|---|
| 2024 | $2,404 | $195,600 | $35,000 | $160,600 |
| 2023 | $2,212 | $192,800 | $35,000 | $157,800 |
| 2022 | $1,844 | $182,400 | $35,000 | $147,400 |
| 2021 | $1,756 | $154,200 | $25,000 | $129,200 |
| 2020 | $1,714 | $147,900 | $20,000 | $127,900 |
| 2019 | $1,480 | $140,400 | $20,000 | $120,400 |
| 2018 | $1,286 | $125,500 | $20,000 | $105,500 |
| 2017 | $1,202 | $117,700 | $20,000 | $97,700 |
| 2016 | $1,268 | $77,800 | $13,300 | $64,500 |
| 2015 | $1,186 | $81,000 | $13,400 | $67,600 |
| 2014 | $1,176 | $81,800 | $13,500 | $68,300 |
| 2012 | -- | $83,500 | $13,565 | $69,935 |
Source: Public Records
Map
Nearby Homes
- 1234 4th St NE
- 1309 3rd St NE
- 216 10th Ave NE
- 1513 4th St NE
- 1400 7th St NE
- 915 E Center St
- 909 E Center St
- 1530 3rd St NE
- 815 E Center St
- 126 11th Ave SE
- 302 17th Ave NE
- 725 16th Ave NE
- 808 13th Ave NE
- 208 8th Ave SE
- 12 6th Ave SE
- 1646 2nd St SE
- 412 12th Ave SE
- 1815 10th St NE
- 1337 6th St SE
- 1409 11th Ave NE
- 1211 3rd St NE
- 1215 3rd St NE
- 1207 3rd St NE
- 1221 3rd St NE
- 1203 3rd St NE
- 1236 4th St NE
- 1232 4th St NE
- 1244 4th St NE
- 1228 4th St NE
- 1225 3rd St NE
- 1117 3rd St NE
- 1212 3rd St NE
- 1216 3rd St NE
- 1206 3rd St NE
- 1248 4th St NE
- 1118 1118 4th-Street-ne
- 1118 4th St NE
- 1218 3rd St NE
- 1204 3rd St NE
- 1229 3rd St NE