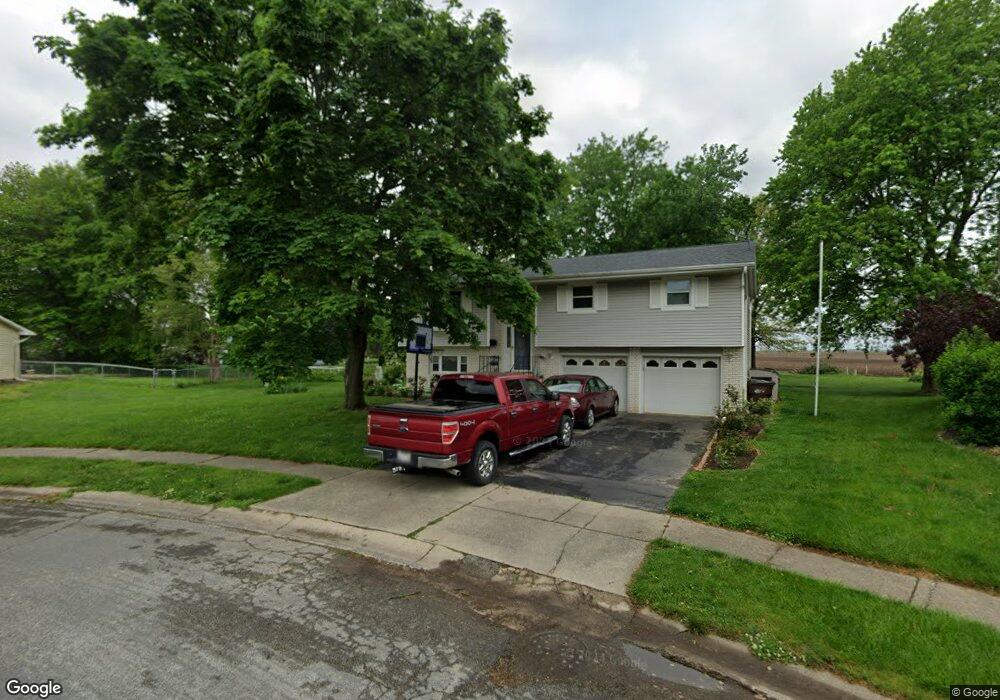
1211 Allied Ave Taylorville, IL 62568
Estimated Value: $187,000 - $246,000
4
Beds
3
Baths
1,912
Sq Ft
$115/Sq Ft
Est. Value
About This Home
This home is located at 1211 Allied Ave, Taylorville, IL 62568 and is currently estimated at $219,990, approximately $115 per square foot. 1211 Allied Ave is a home located in Christian County with nearby schools including North Elementary School, Taylorville Junior High School, and Taylorville Senior High School.
Ownership History
Date
Name
Owned For
Owner Type
Purchase Details
Closed on
Feb 5, 2010
Sold by
Hile Melanie and Daly Melanie
Bought by
Brentz James Michael and Brentz Angela
Current Estimated Value
Home Financials for this Owner
Home Financials are based on the most recent Mortgage that was taken out on this home.
Original Mortgage
$133,000
Interest Rate
5.11%
Mortgage Type
New Conventional
Purchase Details
Closed on
May 15, 2009
Sold by
Hile Brian and Hile Robert
Bought by
Hile Melanie
Purchase Details
Closed on
Apr 10, 2006
Sold by
Butterfield Thomas
Bought by
Hile Brian and Hile Melanie
Home Financials for this Owner
Home Financials are based on the most recent Mortgage that was taken out on this home.
Original Mortgage
$140,514
Interest Rate
6.48%
Mortgage Type
FHA
Create a Home Valuation Report for This Property
The Home Valuation Report is an in-depth analysis detailing your home's value as well as a comparison with similar homes in the area
Home Values in the Area
Average Home Value in this Area
Purchase History
| Date | Buyer | Sale Price | Title Company |
|---|---|---|---|
| Brentz James Michael | $140,000 | None Available | |
| Hile Melanie | -- | Advanced Title Group Inc | |
| Hile Brian | $138,500 | None Available |
Source: Public Records
Mortgage History
| Date | Status | Borrower | Loan Amount |
|---|---|---|---|
| Closed | Brentz James Michael | $133,000 | |
| Previous Owner | Hile Brian | $140,514 |
Source: Public Records
Tax History Compared to Growth
Tax History
| Year | Tax Paid | Tax Assessment Tax Assessment Total Assessment is a certain percentage of the fair market value that is determined by local assessors to be the total taxable value of land and additions on the property. | Land | Improvement |
|---|---|---|---|---|
| 2024 | $3,836 | $59,344 | $11,421 | $47,923 |
| 2023 | $3,560 | $54,365 | $10,463 | $43,902 |
| 2022 | $3,387 | $50,488 | $9,717 | $40,771 |
| 2021 | $3,194 | $48,546 | $9,343 | $39,203 |
| 2020 | $3,248 | $49,423 | $9,509 | $39,914 |
| 2019 | $3,677 | $50,774 | $9,769 | $41,005 |
| 2018 | $3,565 | $48,662 | $9,363 | $39,299 |
| 2017 | $3,457 | $47,434 | $9,127 | $38,307 |
| 2016 | $3,233 | $48,785 | $8,908 | $39,877 |
| 2015 | $3,230 | $48,429 | $8,843 | $39,586 |
| 2014 | $3,186 | $47,410 | $8,657 | $38,753 |
| 2013 | $3,169 | $47,410 | $8,657 | $38,753 |
| 2011 | $2,971 | $45,533 | $8,313 | $37,220 |
Source: Public Records
Map
Nearby Homes
- 910 E Heights Ave
- 100 E Heights Ave Unit 9
- 810 N Snodgrass St
- 1015 E Elm St
- 513 E Oak St
- 516 N Pawnee St
- 1246 N Lawrence Ave
- 704 Hawley Ave
- 1221 E Park St
- 306 E Poplar St
- 913 Hawley Ave
- 240 N Washington St
- 606 N Shumway St
- 507 E Market St
- 729 Kenton Blvd
- 703 Glenhill Rd
- 1918 Greenview
- 833 N Cheney St
- 221 E Adams St
- 402 E Adams St
- 707 E Heights Ave
- 1207 Allied Ave
- 615 E Heights Ave
- 709 E Heights Ave
- 610 E Heights Ave
- 710 E Heights Ave
- 1205 Allied Ave
- 713 E Heights Ave
- 609 E Heights Ave
- 712 E Heights Ave
- 613 Virginia Ave
- 1201 Allied Ave
- 709 Virginia Ave
- 715 E Heights Ave
- 609 Virginia Ave
- 602 E Heights Ave
- 714 E Heights Ave
- 713 Virginia Ave
- 603 Virginia Ave
- 803 E Heights Ave