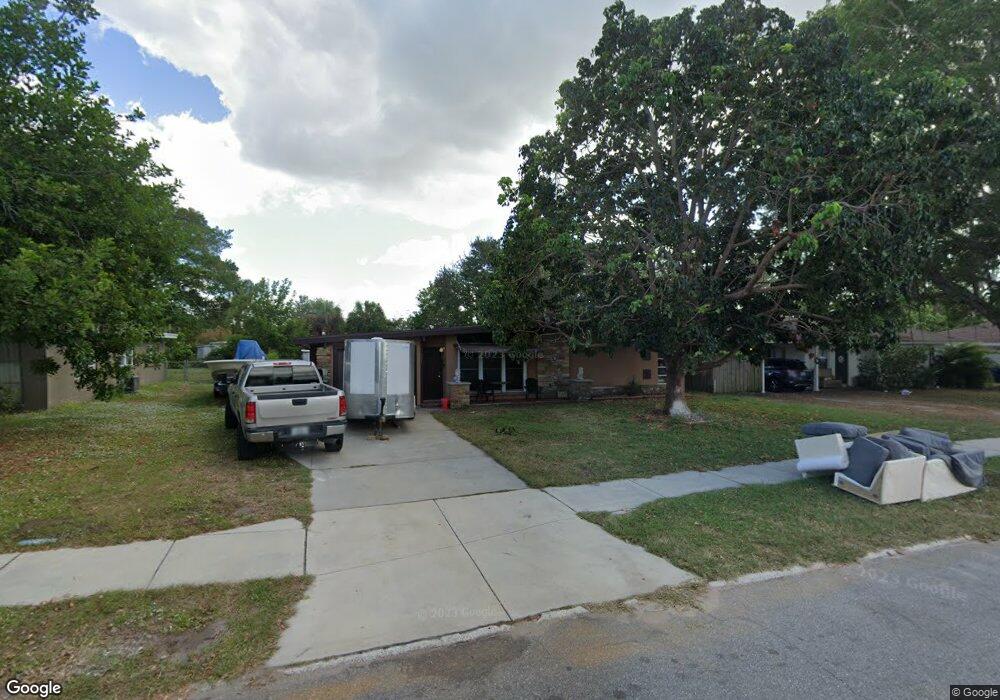
1211 Dartmouth Dr Bradenton, FL 34207
Estimated Value: $336,000 - $370,000
3
Beds
2
Baths
1,482
Sq Ft
$235/Sq Ft
Est. Value
About This Home
This home is located at 1211 Dartmouth Dr, Bradenton, FL 34207 and is currently estimated at $348,415, approximately $235 per square foot. 1211 Dartmouth Dr is a home located in Manatee County with nearby schools including Bayshore Elementary School, Electa Lee Magnet Middle School, and Bayshore High School.
Ownership History
Date
Name
Owned For
Owner Type
Purchase Details
Closed on
Sep 7, 2022
Sold by
Joel Lofgren Douglas and Joel Roger
Bought by
Quattlebaum Tristan and Quattlebaum Madison
Current Estimated Value
Home Financials for this Owner
Home Financials are based on the most recent Mortgage that was taken out on this home.
Original Mortgage
$343,660
Outstanding Balance
$328,458
Interest Rate
5.3%
Mortgage Type
FHA
Estimated Equity
$19,957
Purchase Details
Closed on
Nov 7, 2003
Sold by
Lofgren Roger and Lofgren Sharlot
Bought by
Lofgren Douglas Joel and Lofgren Roger
Purchase Details
Closed on
Mar 7, 2002
Sold by
Lofgren Douglas Hoel and Lofgren Tisha Lynn
Bought by
Lofgren Oger and Lofgren Sharlot
Purchase Details
Closed on
Dec 16, 1993
Sold by
Luallen Clarice Evelyn Ethridge and Ethridge Jack B
Bought by
Lofgren Douglas J
Home Financials for this Owner
Home Financials are based on the most recent Mortgage that was taken out on this home.
Original Mortgage
$67,413
Interest Rate
7.14%
Mortgage Type
FHA
Create a Home Valuation Report for This Property
The Home Valuation Report is an in-depth analysis detailing your home's value as well as a comparison with similar homes in the area
Home Values in the Area
Average Home Value in this Area
Purchase History
| Date | Buyer | Sale Price | Title Company |
|---|---|---|---|
| Quattlebaum Tristan | $350,000 | -- | |
| Lofgren Douglas Joel | $20,000 | -- | |
| Lofgren Oger | -- | -- | |
| Lofgren Douglas J | $67,000 | -- |
Source: Public Records
Mortgage History
| Date | Status | Borrower | Loan Amount |
|---|---|---|---|
| Open | Quattlebaum Tristan | $343,660 | |
| Previous Owner | Lofgren Douglas J | $67,413 |
Source: Public Records
Tax History Compared to Growth
Tax History
| Year | Tax Paid | Tax Assessment Tax Assessment Total Assessment is a certain percentage of the fair market value that is determined by local assessors to be the total taxable value of land and additions on the property. | Land | Improvement |
|---|---|---|---|---|
| 2025 | $4,674 | $245,349 | $61,200 | $184,149 |
| 2024 | $4,674 | $271,657 | $61,200 | $210,457 |
| 2023 | $4,737 | $271,657 | $61,200 | $210,457 |
| 2022 | $3,178 | $193,132 | $0 | $0 |
| 2021 | $2,870 | $158,168 | $55,000 | $103,168 |
| 2020 | $2,074 | $127,139 | $0 | $0 |
| 2019 | $1,979 | $123,441 | $0 | $0 |
| 2018 | $1,849 | $113,591 | $0 | $0 |
| 2017 | $1,560 | $91,864 | $0 | $0 |
| 2016 | $1,457 | $84,379 | $0 | $0 |
| 2015 | $1,361 | $84,058 | $0 | $0 |
| 2014 | $1,361 | $80,099 | $0 | $0 |
| 2013 | $1,261 | $73,073 | $0 | $0 |
Source: Public Records
Map
Nearby Homes
- 2216 N Wellesley Dr
- 1811 Marilyn Ave
- 2307 Emory Ave
- 1801 Marilyn Ave
- 1804 Bayshore Gardens Pkwy
- 6124 Dartmouth Dr
- 6508 Washington St
- 6515 Massachusetts St
- 2416 Emory Ave
- 6072 Arlene Way Unit 94
- 6110 Coral Way
- 6068 Arlene Way Unit 92
- 5981 Hibiscus Dr
- 1608 Bayshore Gardens Pkwy
- 6510 Washington St
- 6512 New Jersey St
- 2431 Bayshore Gardens Pkwy Unit 19
- 6619 Texas St Unit 15
- 6608 Oregon St
- 2232 Orange Blossom Ln
- 1209 Dartmouth Dr
- 1301 Dartmouth Dr
- 1208 Princeton Ave
- 1207 Dartmouth Dr
- 1303 Dartmouth Dr
- 1210 Princeton Ave
- 1206 Princeton Ave
- 1300 Dartmouth Dr
- 1212 Dartmouth Dr
- 1302 Dartmouth Dr
- 1204 Princeton Ave
- 1210 Dartmouth Dr
- 1205 Dartmouth Dr
- 1305 Dartmouth Dr
- 1304 Dartmouth Dr
- 1208 Dartmouth Dr
- 1202 Princeton Ave
- 1307 Dartmouth Dr
- 1203 Dartmouth Dr
- 2008 Princeton Ave