
Seller's Agent in 2026
Ryan Ohri
American Real Estate & Associates
(308) 293-3900
77 in this area
105 Total Sales
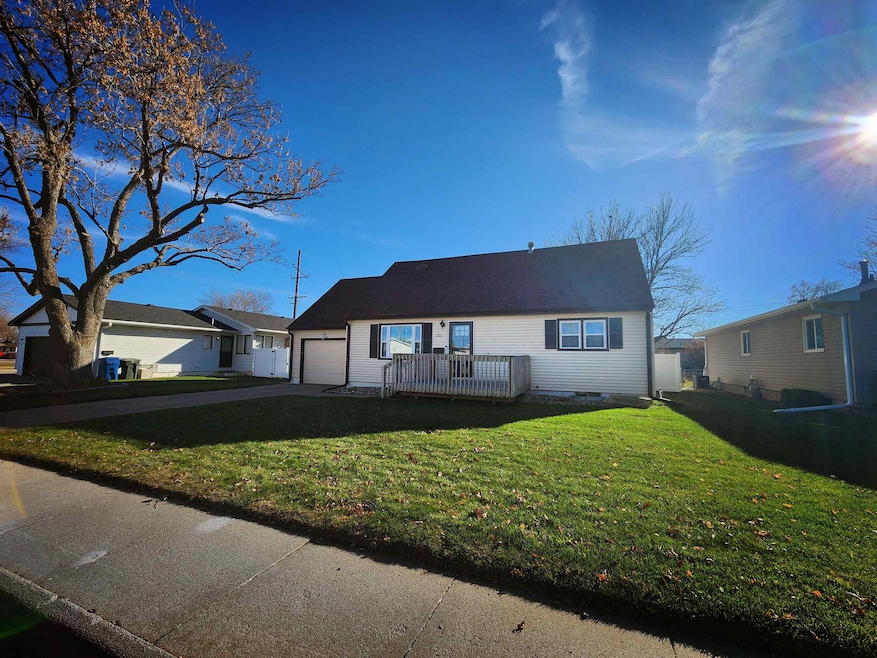

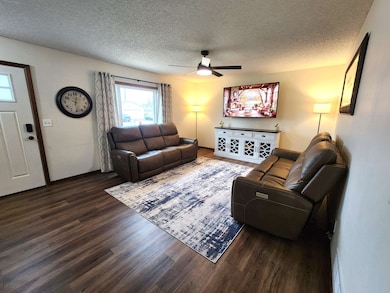
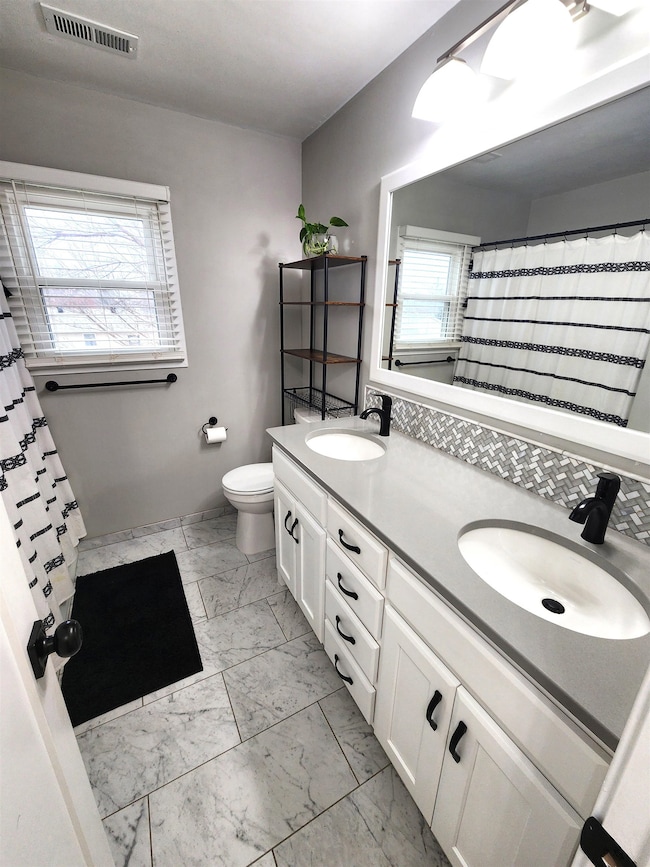
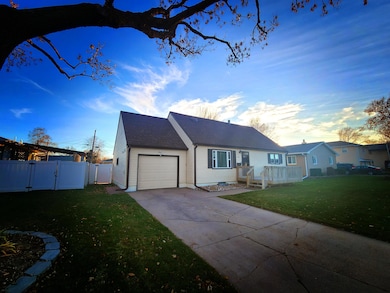
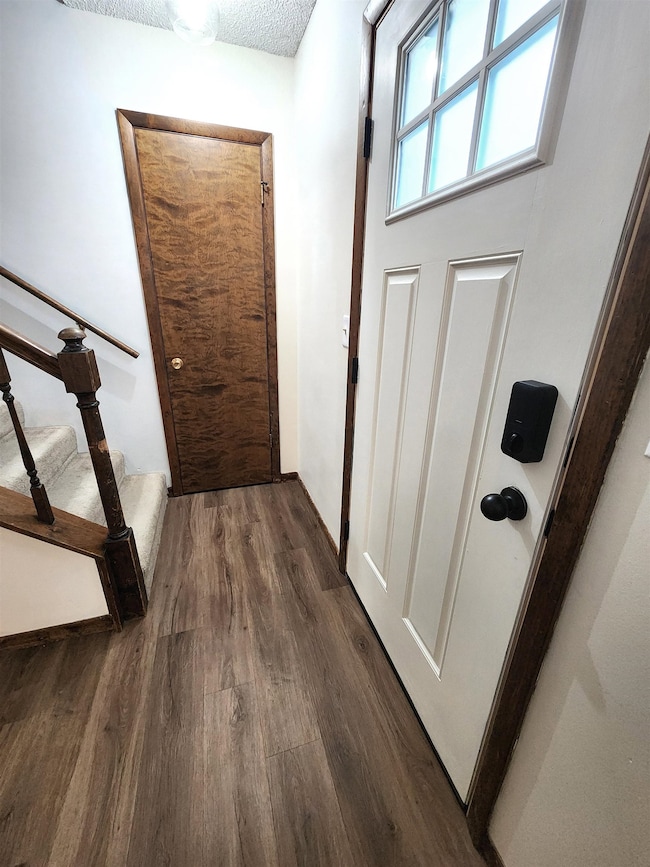
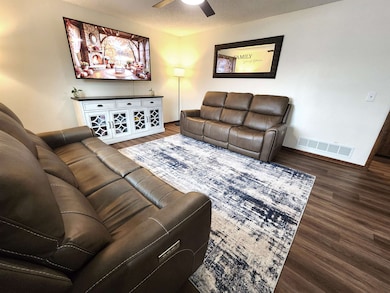
Welcome home to this beautifully maintained 4-bed, 2-bath property in northeast Kearney, complete with a 5th non-conforming bedroom in the finished basement. From the moment you enter, you'll appreciate the thoughtful updates that give this home a fresh, modern feel. Improvements include updated vinyl windows, a remodeled bath, professionally installed luxury vinyl plank flooring, fresh paint, and new trim and doors on the upstairs level that create a clean, cohesive look. The home’s layout offers excellent flexibility with two separate living areas, a comfortable main-floor living room and a spacious lower-level family room, ideal for various everyday needs. A key highlight is the dual-zone HVAC system, allowing the upper level to operate on its own thermostat for enhanced comfort and efficiency throughout the year. Additional features include main-floor laundry, ample basement storage, underground sprinklers, and a fully fenced backyard with a white vinyl privacy fence that provides a low-maintenance and inviting outdoor space. There is even an above ground pool in the backyard offering the relaxation and fun of an inground pool without the extensive cost and on-going maintenance. The pride of ownership shown by the current owners is evident throughout, making this home truly move-in ready. If this property feels like the right fit, you must experience it in person. Schedule your showing today!
Last Agent to Sell the Property
American Real Estate & Associates License #20210462 Listed on: 11/28/2025
| Date | Type | Sale Price | Title Company |
|---|---|---|---|
| Warranty Deed | $269,000 | Nebraska Title | |
| Quit Claim Deed | -- | Barney | |
| Warranty Deed | $132,900 | Barney | |
| Warranty Deed | $120,000 | -- |
| Date | Status | Loan Amount | Loan Type |
|---|---|---|---|
| Open | $201,375 | New Conventional | |
| Previous Owner | $130,492 | FHA | |
| Previous Owner | $96,000 | No Value Available |
| Date | Event | Price | List to Sale | Price per Sq Ft |
|---|---|---|---|---|
| 01/23/2026 01/23/26 | Sold | $268,500 | -2.3% | $107 / Sq Ft |
| 12/15/2025 12/15/25 | Pending | -- | -- | -- |
| 12/12/2025 12/12/25 | Price Changed | $274,900 | -2.8% | $109 / Sq Ft |
| 11/28/2025 11/28/25 | For Sale | $282,800 | -- | $112 / Sq Ft |
| Year | Tax Paid | Tax Assessment Tax Assessment Total Assessment is a certain percentage of the fair market value that is determined by local assessors to be the total taxable value of land and additions on the property. | Land | Improvement |
|---|---|---|---|---|
| 2025 | $3,019 | $234,975 | $35,000 | $199,975 |
| 2024 | $3,520 | $213,920 | $33,980 | $179,940 |
| 2023 | $3,520 | $206,795 | $33,980 | $172,815 |
| 2022 | $3,534 | $201,375 | $33,405 | $167,970 |
| 2021 | $3,275 | $189,870 | $34,150 | $155,720 |
| 2020 | $3,302 | $190,905 | $35,185 | $155,720 |
| 2019 | $3,284 | $187,565 | $35,010 | $152,555 |
| 2018 | $3,062 | $177,395 | $31,305 | $146,090 |
| 2017 | $2,804 | $163,530 | $31,305 | $132,225 |
| 2016 | $2,781 | $163,540 | $31,305 | $132,235 |
| 2015 | $2,742 | $157,660 | $0 | $0 |
| 2014 | $2,782 | $145,920 | $0 | $0 |
Seller's Agent in 2026
Ryan Ohri
American Real Estate & Associates
(308) 293-3900
77 in this area
105 Total Sales
Buyer's Agent in 2026
Pamela Gibbs
NP Realty, Inc.
(308) 440-5397
31 in this area
79 Total Sales
Source: REALTORS® of Greater Mid-Nebraska
MLS Number: 20251564
APN: 602534000
Ask me questions while you tour the home.