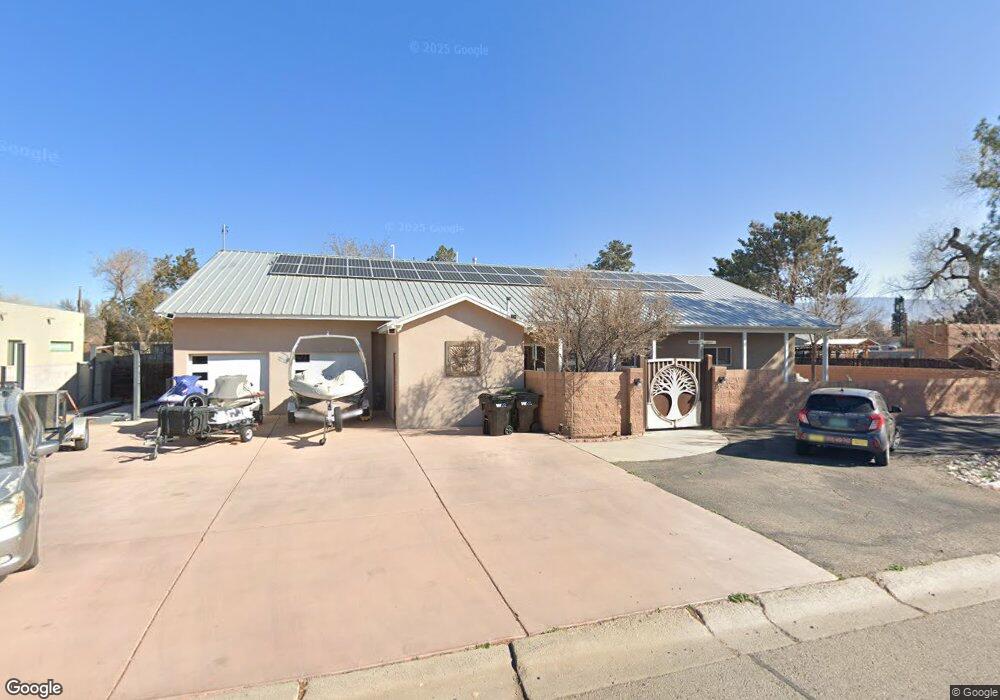
1211 El Portal NW Los Ranchos, NM 87107
Estimated Value: $599,124 - $986,000
3
Beds
2
Baths
2,892
Sq Ft
$268/Sq Ft
Est. Value
About This Home
This home is located at 1211 El Portal NW, Los Ranchos, NM 87107 and is currently estimated at $775,031, approximately $267 per square foot. 1211 El Portal NW is a home located in Bernalillo County with nearby schools including Alvarado Elementary School, Valley High School, and North Valley Academy.
Ownership History
Date
Name
Owned For
Owner Type
Purchase Details
Closed on
Nov 27, 2012
Sold by
Hauser Michael R
Bought by
Williams Christine S
Current Estimated Value
Purchase Details
Closed on
Oct 29, 2001
Sold by
Salas Richard
Bought by
Strauss Eric R
Purchase Details
Closed on
Jun 26, 2000
Sold by
Johnson Lynn M
Bought by
Strauss Eric R and Strauss Linda M
Home Financials for this Owner
Home Financials are based on the most recent Mortgage that was taken out on this home.
Original Mortgage
$112,100
Interest Rate
8.5%
Purchase Details
Closed on
May 24, 2000
Sold by
Williams Kenneth R
Bought by
Johnson Lynn M
Home Financials for this Owner
Home Financials are based on the most recent Mortgage that was taken out on this home.
Original Mortgage
$112,100
Interest Rate
8.5%
Purchase Details
Closed on
Apr 21, 2000
Sold by
Williams Kenneth R and Williams Niya A
Bought by
Williams Kenneth R and Kyla Williams Irrevocable Trust
Create a Home Valuation Report for This Property
The Home Valuation Report is an in-depth analysis detailing your home's value as well as a comparison with similar homes in the area
Home Values in the Area
Average Home Value in this Area
Purchase History
| Date | Buyer | Sale Price | Title Company |
|---|---|---|---|
| Williams Christine S | -- | Fidelity National Title Of N | |
| Strauss Eric R | -- | -- | |
| Strauss Eric R | -- | Albuquerque Title | |
| Johnson Lynn M | -- | -- | |
| Johnson Lynn M | -- | -- | |
| Williams Kenneth R | -- | -- |
Source: Public Records
Mortgage History
| Date | Status | Borrower | Loan Amount |
|---|---|---|---|
| Previous Owner | Strauss Eric R | $112,100 |
Source: Public Records
Tax History Compared to Growth
Tax History
| Year | Tax Paid | Tax Assessment Tax Assessment Total Assessment is a certain percentage of the fair market value that is determined by local assessors to be the total taxable value of land and additions on the property. | Land | Improvement |
|---|---|---|---|---|
| 2024 | $3,280 | $88,048 | $19,809 | $68,239 |
| 2023 | $3,218 | $85,484 | $19,232 | $66,252 |
| 2022 | $3,029 | $82,994 | $18,672 | $64,322 |
| 2021 | $2,927 | $80,577 | $18,128 | $62,449 |
| 2020 | $2,872 | $78,230 | $17,600 | $60,630 |
| 2019 | $2,785 | $75,952 | $17,088 | $58,864 |
| 2018 | $2,686 | $75,952 | $17,088 | $58,864 |
| 2017 | $2,585 | $73,740 | $16,590 | $57,150 |
| 2016 | $2,486 | $69,508 | $15,638 | $53,870 |
| 2015 | $67,484 | $67,484 | $15,183 | $52,301 |
| 2014 | $2,297 | $65,519 | $14,741 | $50,778 |
| 2013 | -- | $57,141 | $14,312 | $42,829 |
Source: Public Records
Map
Nearby Homes
- 5800 Tinnin Rd NW
- 1513 Tinnin Rd NW
- 1604 Narcisa Ct NW
- 1001 Cottonwood Dr NW
- 1004 Cottonwood Place NW
- 5405 Eakes Rd NW
- 5553 Eakes Rd NW
- 7017 Rio Grande Blvd NW
- 7012 Rio Grande Blvd NW
- 1105 Salamanca St NW
- 7028 Rio Grande Blvd NW
- 934 Fairway Rd NW
- 800 Pueblo Solano Rd NW
- 747 Fairway Rd NW
- 7512 Rio Grande Blvd NW
- 704 Tyler Rd NW
- 6611 Las Casitas Ct NW
- 921 Chamisal Rd NW
- 7601 Rio Grande Blvd NW
- 2705 Pueblo Grande Trail NW
- 1411 El Portal NW
- 5817 El Prado Rd NW
- 1207 El Portal NW
- 5723 El Prado Rd NW
- 5724 El Prado Rd NW
- 1419 El Portal NW
- 5827 El Prado Rd NW
- 1418 El Portal Rd
- 1206 El Portal NW
- 5824 El Prado Rd NW
- 1201 El Portal NW
- 5720 El Prado Rd NW
- 1418 El Portal NW
- 5719 El Prado Rd NW
- 5837 El Prado Rd NW
- 5838 El Prado Rd NW
- 5716 El Prado Rd NW
- 5804 Tinnin Rd NW
- 5715 El Prado Rd NW
- 5847 El Prado Rd NW