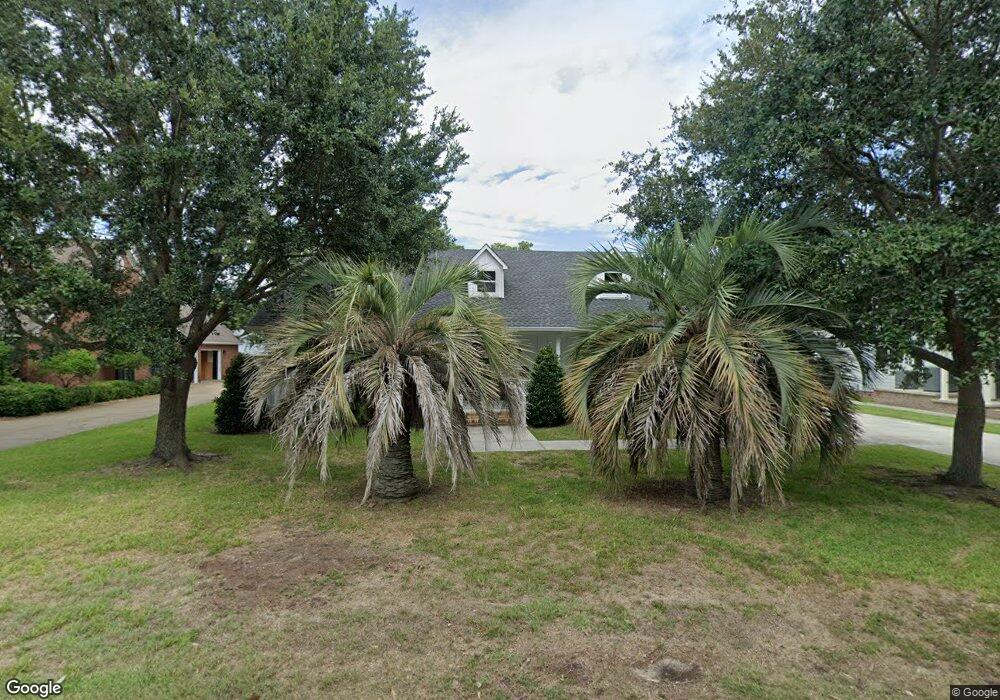
1211 Farnsworth Ave Pascagoula, MS 39567
Estimated Value: $188,000 - $256,000
--
Bed
2
Baths
2,058
Sq Ft
$107/Sq Ft
Est. Value
About This Home
This home is located at 1211 Farnsworth Ave, Pascagoula, MS 39567 and is currently estimated at $219,252, approximately $106 per square foot. 1211 Farnsworth Ave is a home located in Jackson County with nearby schools including Beach Elementary School, Trent Lott Academy, and Colmer Middle School.
Ownership History
Date
Name
Owned For
Owner Type
Purchase Details
Closed on
Sep 17, 2025
Sold by
Mccarty Lance H
Bought by
Mccarty Nicholas
Current Estimated Value
Home Financials for this Owner
Home Financials are based on the most recent Mortgage that was taken out on this home.
Original Mortgage
$242,320
Outstanding Balance
$242,320
Interest Rate
6.58%
Mortgage Type
Seller Take Back
Estimated Equity
-$23,068
Purchase Details
Closed on
Apr 1, 2019
Sold by
Moore Michael R and Moore Adelaide C
Bought by
Mccarty Lance H
Purchase Details
Closed on
May 25, 2016
Bought by
Moore Adelaide and Moore Michael
Home Financials for this Owner
Home Financials are based on the most recent Mortgage that was taken out on this home.
Original Mortgage
$132,000
Interest Rate
3.58%
Purchase Details
Closed on
Jul 19, 2013
Sold by
Moore Paul H
Bought by
Jean M Moore Family Trust
Create a Home Valuation Report for This Property
The Home Valuation Report is an in-depth analysis detailing your home's value as well as a comparison with similar homes in the area
Home Values in the Area
Average Home Value in this Area
Purchase History
| Date | Buyer | Sale Price | Title Company |
|---|---|---|---|
| Mccarty Nicholas | -- | Island Winds Title | |
| Mccarty Nicholas | -- | Island Winds Title | |
| Mccarty Lance H | -- | -- | |
| Moore Adelaide | -- | -- | |
| Jean M Moore Family Trust | -- | -- |
Source: Public Records
Mortgage History
| Date | Status | Borrower | Loan Amount |
|---|---|---|---|
| Open | Mccarty Nicholas | $242,320 | |
| Closed | Mccarty Nicholas | $242,320 | |
| Previous Owner | Moore Adelaide | $132,000 | |
| Previous Owner | Moore Adelaide | -- |
Source: Public Records
Tax History Compared to Growth
Tax History
| Year | Tax Paid | Tax Assessment Tax Assessment Total Assessment is a certain percentage of the fair market value that is determined by local assessors to be the total taxable value of land and additions on the property. | Land | Improvement |
|---|---|---|---|---|
| 2024 | $3,638 | $23,209 | $6,047 | $17,162 |
| 2023 | $3,638 | $23,209 | $6,047 | $17,162 |
| 2022 | $2,103 | $15,472 | $4,031 | $11,441 |
| 2021 | $2,112 | $15,530 | $4,031 | $11,499 |
| 2020 | $2,098 | $15,273 | $4,243 | $11,030 |
| 2019 | $2,118 | $15,273 | $4,243 | $11,030 |
| 2018 | $2,148 | $15,273 | $4,243 | $11,030 |
| 2017 | $1,828 | $15,273 | $4,243 | $11,030 |
| 2016 | $3,117 | $22,373 | $6,158 | $16,215 |
| 2015 | $3,089 | $147,820 | $41,050 | $106,770 |
| 2014 | $3,198 | $22,792 | $6,158 | $16,634 |
| 2013 | $1,056 | $15,194 | $4,105 | $11,089 |
Source: Public Records
Map
Nearby Homes
- 713 Farnsworth Ave
- 865 Market St
- 734 Market St
- 1009 Resca de La Palma St
- 704 Washington Ave
- 1106 Resca de La Palma St
- 1309 Pascagoula St
- 1407 Mantou St
- 1003 Mantou St
- 1603 Williams St
- 1607 Resca de La Palma St
- 1907 Resca de La Palma St
- 1411 Mantou St
- 1505 Roosevelt St
- 1603 Roosevelt St
- 800 12th St
- 1815 Cherubusco St
- 2117 Seneca Ave
- 0 E St
- 1709 Smith Ave
- 1214 Farnsworth Ave
- 1201 Farnsworth Ave
- 1215 Farnsworth Ave
- 1115 Farnsworth Ave
- 1206 Washington Ave
- 1205 Beach Blvd
- 1201 Beach Blvd
- 1202 Washington Ave
- 1306 Washington Ave
- 1211 Beach Blvd
- 1105 Beach Blvd
- 1109 Beach Blvd
- 512 Pascagoula St
- 514 Pascagoula St
- 1310 Washington Ave
- 1303 Beach Blvd
- 1209 Washington Ave
- 1215 Washington Ave
- 1305 Beach Blvd
- 1101 Beach Blvd